Confused by unpredictable market moves? Understanding market structure is the key to reading the market's story, turning chaos into a clear narrative of trends and reversals. This guide provides a practical, no-hype framework to help you identify high-probability setups, manage risk, and trade with a professional edge.
Why Market Structure Trading Is A Foundational Skill

Trading without understanding market structure is like building a house without a blueprint. You might get a few pieces in place by luck, but you can't construct anything stable. Structure provides the context you need to make sense of what price is actually doing.
For funded traders, this skill is critical. Prop firm accounts come with strict risk rules like daily and maximum drawdown limits. A couple of poorly placed trades, born from misreading market direction, can end your challenge instantly. A solid grasp of market structure helps you avoid these critical errors.
The Shift In Modern Markets
Markets today don't behave like they used to. Price now spends far more time consolidating in ranges than it does trending. Instead of sharp, fast moves to find new value, buyers and sellers often battle for extended periods.
This is a consequence of deep, instant liquidity. For traders, this means market structure trading is less about catching huge trends and more about skillfully navigating rotations inside well-defined ranges.
Simply drawing static support and resistance lines is no longer enough. Success now depends on your ability to read real-time price action within the current market structure.
Building Your Strategic Framework
Mastering market structure provides the foundation for a robust trading framework. It gives you clear, objective answers to the most important questions before risking a single dollar:
- What is the dominant trend? Are we pushing up, heading down, or chopping sideways?
- Where are the high-probability entry points? Structure reveals key levels where you have an edge.
- Where should my stop loss go? Structure provides logical, protected places to hide your stop from random market noise.
- What are realistic profit targets? You can set logical take-profit levels based on the next structural point.
Grounding every decision in market structure helps you move from gambling to executing a calculated plan. This is the disciplined, rules-based approach that prop firms value. If you're serious about taking your skills to this level, you can explore relevant courses that dive deep into these strategies.
Decoding The Building Blocks of Market Structure
To read the market’s story, you must first learn its language. Market structure is that language, composed of core elements that form every trend, reversal, and consolidation you see on a chart.
Let's get practical. Learning to spot these patterns in real-time is the first step toward building a trading strategy you can trust.
Identifying The Primary Market States
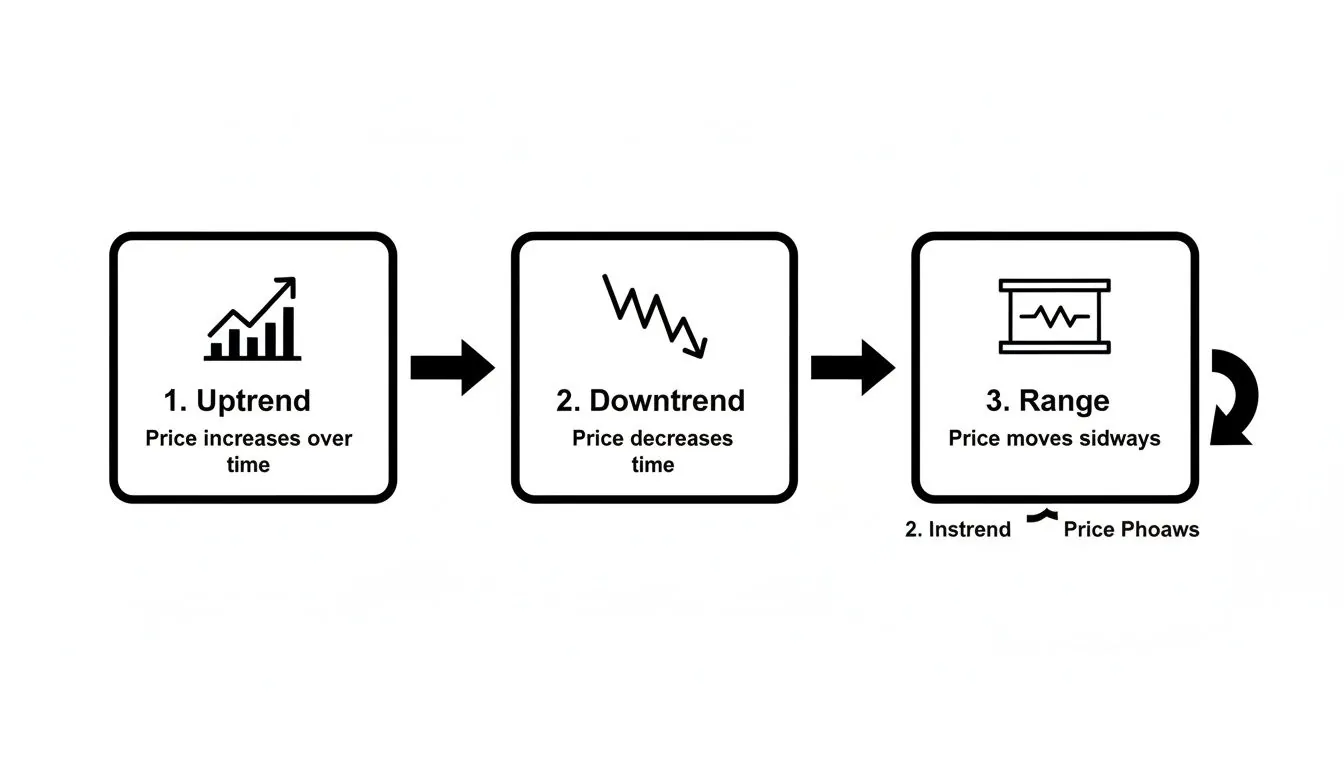
The market is only ever doing one of three things. Your first job is to figure out which state we're in right now.
- Uptrend (Bullish Structure): Price makes a series of Higher Highs (HH) and Higher Lows (HL). Each pullback stops short of the previous low, showing that buyers are in control.
- Downtrend (Bearish Structure): The market carves out a series of Lower Lows (LL) and Lower Highs (LH). This tells you sellers are running the show, pushing prices to new lows.
- Range (Consolidation): Price gets stuck between clear support and resistance levels, failing to make new highs or lows. This signals a stalemate between buyers and sellers.
Trying to use a trend-following strategy in a choppy range will get you diced to pieces, just as a range-trading strategy will get run over by a powerful trend.
Key Market Structure Components At A Glance
| Structural Component | What It Looks Like | What It Signals |
|---|---|---|
| Higher High (HH) | Price breaks above the previous swing high. | The uptrend is continuing; buyers are still in control. |
| Higher Low (HL) | A pullback in an uptrend that finds support above the previous swing low. | Confirmation of bullish strength; buyers are defending higher prices. |
| Lower Low (LL) | Price breaks below the previous swing low. | The downtrend is continuing; sellers are pushing the market down. |
| Lower High (LH) | A rally in a downtrend that gets rejected below the previous swing high. | Confirmation of bearish strength; sellers are preventing a recovery. |
The real skill comes from seeing how these components interact to signal shifts in market dynamics.
The Break of Structure vs The Change of Character
Once you can spot the trend, the next step is identifying events that signal whether it's likely to continue or reverse.
A Break of Structure (BoS) is a move that happens in the direction of the trend. In an uptrend, a BoS occurs when price smashes through the previous Higher High to create a new one. This is a confirmation signal—it tells you the trend is healthy.
On the other hand, a Change of Character (CHoCH) is the first warning sign that a trend might be losing steam.
A Change of Character is the market firing a warning shot. In a textbook uptrend, it's what happens when price fails to make a new Higher High and instead breaks below the most recent Higher Low.
This event doesn't guarantee the trend is dead, but it signals a major power shift. It's your cue to stop looking for trend-continuation trades and start paying attention to a potential reversal. These structural shifts are driven by deeper forces of order flow; you can learn more in our guide on Auction Market Theory.
Being able to tell the difference between a BoS and a CHoCH is what separates traders who react from those who anticipate. This is the essence of market structure trading.
A Practical Workflow For Multi-Timeframe Analysis
Effective market structure trading isn't about getting lucky on one chart. It's about building a complete story by layering insights from different timeframes. This approach helps you trade with the market's current, not against it.
This workflow is especially critical for a funded account, as it helps you avoid risky counter-trend moves that can quickly erode your daily drawdown.
Our analysis starts with identifying one of these three market states.
Start With The High-Timeframe Narrative (HTF)
Every solid trade idea begins on a higher timeframe, like the Daily (D) or 4-Hour (4H) chart. Your only job here is to understand the big picture.
On your HTF chart, look for the primary market bias:
- Is price in a clear uptrend (Higher Highs and Higher Lows)?
- Is it in a downtrend (Lower Lows and Lower Highs)?
- Or is it stuck in a wide, defined range?
This top-down perspective tells you which side to be on. If the 4H is bullish, you should be hunting for buys. Trying to short every small pullback is like swimming against a riptide. These larger trends are often driven by big-picture economics. You can learn more about trends shaping global trade from UNCTAD to see how this plays out.
Refine Your Area Of Interest On The Medium-Timeframe (MTF)
Once you have the HTF story, zoom in to a medium timeframe, like the 1-Hour (1H) chart. Here, your goal is to find a high-probability zone for a trade setup.
For example, if the 4H trend is bullish, scan the 1H chart to find the most recent Higher Low or a key demand area. This becomes your "area of interest." You're not placing an order yet—you're patiently waiting for the market to come to you.
The medium timeframe acts as a filter. It connects the high-level story to a specific, actionable zone, preventing you from chasing price in the middle of a move.
This discipline forces you to wait for A+ setups at structurally important levels.
Execute With Precision On The Low-Timeframe (LTF)
Once price pulls back into your 1H area of interest, drop down to a low timeframe like the 15-Minute (15M) for execution. Here, you are looking for a clear signal that the pullback is over and the HTF trend is resuming.
Here’s the full process:
- HTF (4H): Spot a clear uptrend. Bias is bullish.
- MTF (1H): Mark out the last significant Higher Low and wait for price to test that zone.
- LTF (15M): As price hits your 1H level, watch for the internal structure to flip. The 15M trend was bearish during the pullback, so you wait for it to break and shift back to bullish—a Change of Character (CHoCH).
That 15M shift is your confirmation. Using an LTF trigger allows for a much tighter stop loss, which dramatically improves your risk-to-reward ratio. This is key to thriving with market structure trading within the strict risk rules of a prop firm.
Actionable Market Structure Trade Setups
You have the theory. Now, how do you turn that understanding into a repeatable, rules-based trading plan? Here are two reliable trade setups that grow directly out of market structure.
Mastering these provides a solid foundation for consistent trading, especially within the tight risk parameters of a funded account.
Setup 1: The Break and Retest
The "Break and Retest" (B&R) is a classic trend continuation setup. The goal is to enter a trade after the market has confirmed its direction, offering a safer entry than chasing a breakout.
The logic is simple:
- Price pushes through a key structural point (e.g., a Higher High in an uptrend).
- It then pulls back to "retest" that same level, which should now act as support.
- You enter when that retest holds, ready to catch the next push in the trend's direction.
The Break and Retest prevents you from buying the absolute top or selling the absolute bottom. It forces you to wait for a discounted entry after the market has shown its hand.
This disciplined approach helps you avoid emotional trades driven by FOMO (fear of missing out).
The Bullish Break and Retest Checklist
Let's say you're looking at a long trade on EUR/USD. Tick every box before entering:
- HTF Bias: The 4H chart is in a clear uptrend (HHs and HLs).
- Break of Structure (BoS): Price has clearly broken and closed above the most recent 4H Higher High.
- Retest Zone: Price is now pulling back into the zone of the old resistance it just broke.
- LTF Confirmation: On the 15M chart, wait to see the pullback's small bearish trend get broken with a bullish Change of Character (CHoCH).
- Entry: Place your long entry right after that 15M CHoCH is confirmed.
- Stop-Loss: Your stop goes just below the new structural low that formed on the 15M chart.
- Take-Profit: Aim for the next logical structural high on the 4H chart.
Setup 2: The Reversal Setup
The Reversal Setup is about catching a new trend as it begins. This setup focuses on identifying a confirmed Change of Character (CHoCH) on a higher timeframe, signaling the old trend has run out of steam.
This setup requires more caution because you are stepping in front of the old momentum. However, a successful reversal can offer incredible risk-to-reward. The secret is waiting for undeniable confirmation.
The Bearish Reversal Checklist
Imagine watching Gold (XAU/USD) rocket up, but now you see signs it's getting tired. Here’s your checklist for a potential short:
- HTF Shift: On the 4H chart, the uptrend fails. Price breaks below the last major Higher Low, confirming a CHoCH.
- New Bearish Structure: The market forms its first Lower High, proving sellers are stepping in.
- Entry Zone: Wait for price to rally back toward that newly created Lower High. This is your prime entry zone.
- LTF Confirmation: As price enters your zone, switch to the 15M chart. Wait for the structure of that small rally to break down with a bearish CHoCH.
- Entry: Take your short position as soon as that 15M bearish confirmation prints.
- Stop-Loss: Place your stop just above the 4H Lower High. If price breaks this, your trade idea is wrong.
- Take-Profit: Your first target should be the most recent major low on the 4H chart.
Religiously following these checklists for market structure trading removes guesswork and emotion. Every trade becomes part of a logical, repeatable process—the cornerstone of a sustainable career as a funded trader.
Integrating Risk Management With Market Structure

When trading a funded account, your first job isn't to make money—it's to protect capital. A solid grasp of market structure trading becomes your most valuable asset for risk management. It gives you a logical, chart-based blueprint for every decision.
Successful funded traders perfectly blend their strategy with the firm's drawdown rules.
Setting Stops Based On Structure, Not Pips
Using arbitrary stop-losses like a "20-pip stop" is a quick way to blow an account. A professional places their stop-loss at the exact point where their trade idea is proven wrong.
If you're buying at a Higher Low in an uptrend, your trade is invalidated the moment price breaks below that Higher Low. That's your structural point of failure, and that's where your stop belongs.
Your stop-loss isn't just a safety net; it's the specific price point that invalidates your entire trade idea. Place it logically just beyond the structural point that, if broken, tells you you were wrong.
If a logical stop placement requires a tiny position size, it's a red flag that your entry may be in a poor location.
Sizing Your Position For Drawdown Rules
Once you've set a logical stop, calculating position size is straightforward. This directly ties your trade to the funded account's risk limits, like the 5% daily drawdown and 10% maximum drawdown.
Here’s a practical example with a $100,000 account:
- Define Your Risk Per Trade: A conservative rule is to risk no more than 1% of your account per trade. On a $100k account, that’s a maximum loss of $1,000.
- Identify Your Structural Stop: You spot a long setup on EUR/USD. The last Higher Low is at 1.07200. You set your stop just below it at 1.07150. With an entry at 1.07400, your total risk is 25 pips.
- Calculate Position Size: To risk $1,000 with a 25-pip stop on EUR/USD, you would trade 4 standard lots ($10/pip * 4 lots * 25 pips = $1,000 risk).
Following this process helps you build a buffer against losing streaks. For more detail, check out our guide on risk management in Forex trading.
Setting Realistic Profit Targets
Market structure also provides logical places to take profit. Forget hoping for home runs; aim for the next major structural level.
- In an uptrend, your first target is the previous Higher High.
- In a downtrend, you'd aim for the previous Lower Low.
This approach lets you define your risk-to-reward (R/R) ratio before entering. If your stop is 25 pips and your target is 50 pips, you have a clean 1:2 R/R trade. Executing trades with a consistently positive R/R is the mathematical edge that allows traders to be profitable even if they only win 50% of their trades. Remember, trading involves substantial risk of loss and is not suitable for all investors.
Becoming A Funded Trader With Your Strategy
You’ve put in the work to understand market structure. What's next? Turning that knowledge into a professional trading career.
Proprietary trading firms look for consistency, discipline, and a definable edge. A strategy built on market structure provides all three. It's a clear, repeatable process that a professional environment demands.
A robust strategy grounded in market structure is your blueprint for navigating the challenges of a funded account. It proves you have a repeatable process for identifying and managing trades professionally.
Think of our rules not as limitations, but as a professional framework. When you can consistently apply your strategy while respecting parameters like the 5% daily drawdown and 10% maximum drawdown, you're demonstrating that you can handle real capital.
Ready to see what you can do? Before you jump in, read our guide on how to get a funded trading account for a complete overview of the process.
FAQ: Your Top Market Structure Questions
Here are answers to some of the most common questions traders have when applying market structure analysis.
How do I know if it is a real break of structure or a fakeout?
Distinguishing a real break from a fakeout (or liquidity grab) is a key skill. The best evidence is a candle body closing decisively beyond the structural point. A long wick that just pokes through and retreats often signals a fakeout. After a break, watch for commitment. If price immediately snaps back inside the old range, it was likely a fakeout. Patience is crucial; wait for the market to confirm its move.
Can I use market structure on lower timeframes like the 1-minute?
Yes, market structure is fractal, meaning the same patterns repeat on all timeframes. However, trading on timeframes like the 1-minute is extremely fast-paced and "noisy." A safer approach is to use a multi-timeframe workflow. Use the 1-Hour or 4-Hour chart to determine your directional bias, then use the 15-minute or 5-minute chart to pinpoint your entry. This keeps you aligned with the larger market flow, which is the core of market structure trading.
What are the best indicators to use with market structure?
While a clean chart is best, a few indicators can add confirmation to your price action analysis.
- Moving Averages: A 20 or 50 EMA can help visualize the trend and dynamic support/resistance.
- Volume: A surge in volume on a breakout suggests strong conviction behind the move.
- Relative Strength Index (RSI): This is excellent for spotting divergence. If price makes a new high but the RSI makes a lower high, it warns that the trend might be losing momentum.
The golden rule: indicators should support a trade idea that market structure already provides. Never take a trade based on an indicator alone if it contradicts the structure.
At MyFundedCapital, we're built for traders who use a disciplined, rules-based strategy like market structure. Whether you prove your skills in a challenge or get started with an Instant Funding account, we give you the capital and the framework to trade properly.
Explore our funding programs today!