You see a stock explode higher, miss the first move, and then freeze when price starts drifting sideways. Most newer traders either chase the breakout too late or assume the move is over and walk away. Both mistakes are expensive.
Flag pattern stocks sit right in that zone of uncertainty. If you can read them properly, they give you a structured way to join momentum without guessing. If you need a refresher on what is technical analysis, start there, then come back and use this guide to turn chart theory into a repeatable process.
Introduction Trading's Most Powerful Continuation Signal
A good flag pattern doesn't look dramatic once it starts forming. That's why traders miss it. The emotional move happened during the first impulse, and by the time the flag appears, the chart looks boring.
That boredom matters. In many cases, the pause is exactly what makes the setup tradable. Instead of buying a vertical move or shorting into panic, you wait for structure, define your risk, and act only when price confirms.
For traders working toward funded trading, that matters even more. Prop-style risk rules punish random entries, oversized positions, and late decisions. Flag pattern stocks are useful because they give you a clean framework. You can identify the move, map the pause, define the invalidation point, and decide whether the trade deserves capital.
Practical rule: If you can't point to the pole, the flag, and the breakout level in under a minute, it's probably not a clean flag.
The Anatomy of a Flag Pattern
A flag pattern has three parts. The flagpole, the flag, and the breakout. If one part is missing or weak, the setup gets weaker fast.
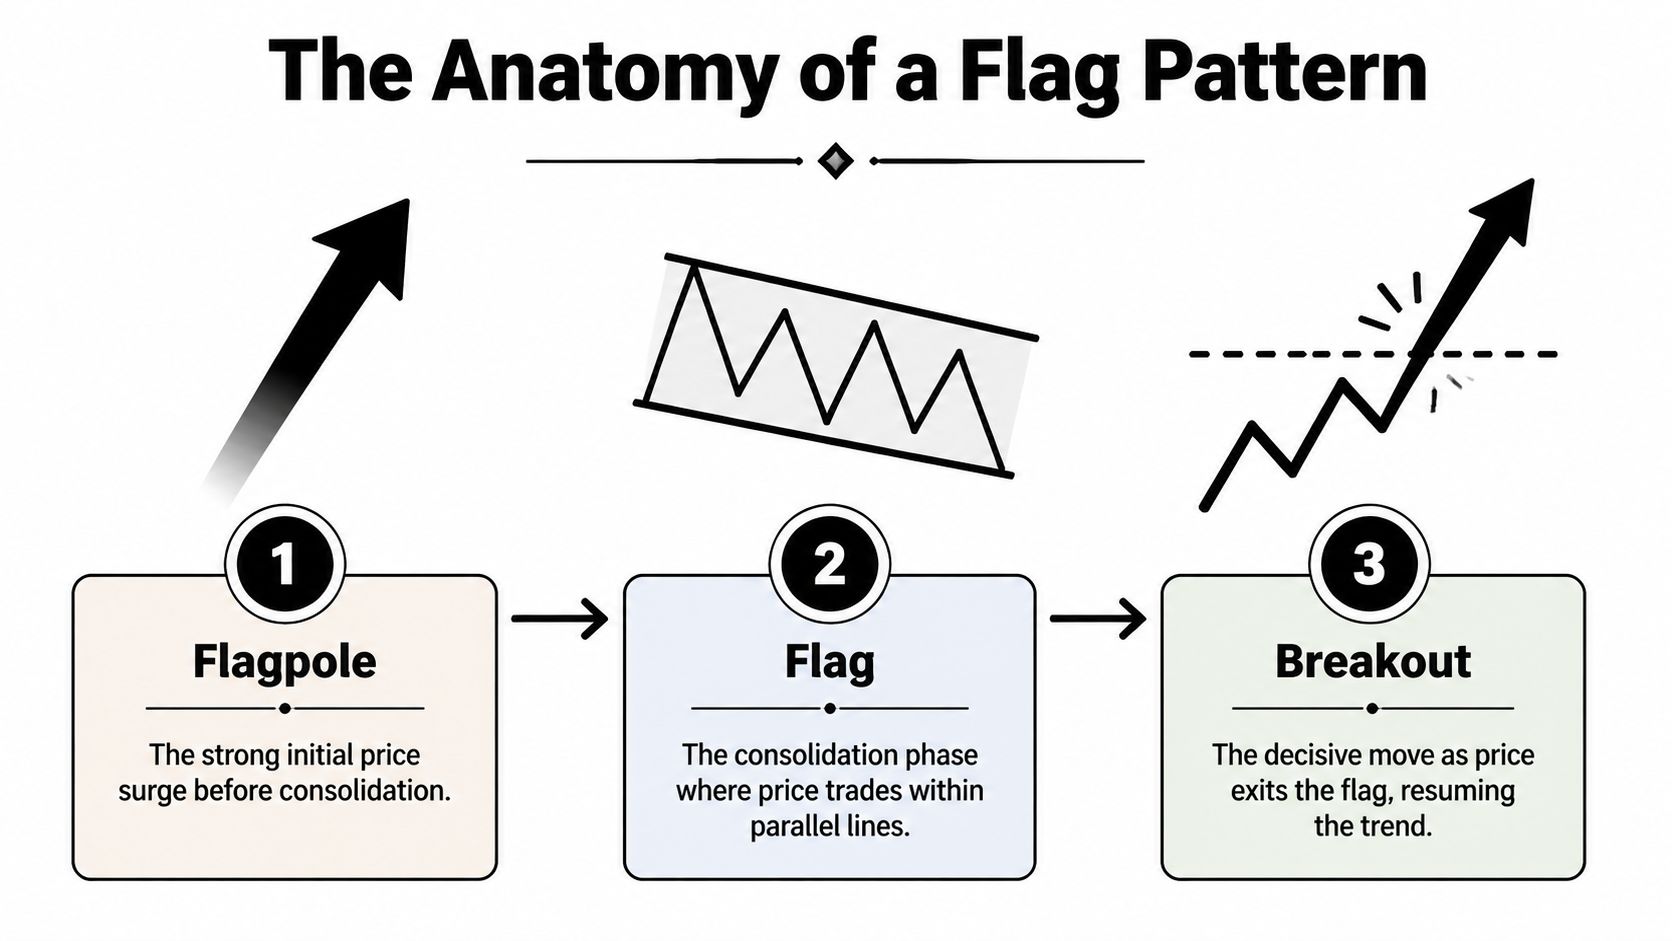
The flagpole
The flagpole is the sharp initial move. In practice, this is the part of the chart that grabs attention. Buyers or sellers take control, price moves aggressively, and volume expands.
That surge matters because a flag is a continuation pattern, not a pattern that creates momentum from nothing. No strong move first, no valid flag later. A quiet drift that turns into a channel is usually just noise.
The psychology is straightforward. One side of the market gets trapped or overrun. Momentum traders pile in. Late participants chase. The move becomes obvious enough that almost everyone can see it, which is exactly why the next phase tends to slow down.
The flag
The flag itself is the pause. Price stops trending vertically and starts moving inside a tight, parallel channel that usually slopes against the original move.
In a bullish setup, the channel often tilts lower. In a bearish one, it often tilts higher. That counter-trend drift is normal. It reflects profit-taking, smaller countertrend orders, and the market absorbing the first burst of momentum.
A real flag should feel controlled, not messy. You want to see price respecting parallel boundaries rather than whipping around with no structure. If the consolidation gets loose and erratic, the market isn't pausing cleanly. It's becoming uncertain.
A few things matter here:
- Shape matters: The channel should look rectangular or like a neat parallelogram, not a wedge or triangle.
- Context matters: The move before the flag should still dominate the chart visually.
- Volume matters: During valid flags, volume typically fades as the pattern forms, which signals the counter-move lacks conviction.
The breakout
The breakout is where the trade either becomes actionable or gets rejected. Price leaves the channel in the direction of the original trend and volume should come back in.
This is the point where many traders get sloppy. They anticipate instead of waiting. They buy the middle of the flag, short the lower boundary too early, or convince themselves that one intrabar push is enough confirmation.
It usually isn't.
A breakout without conviction is just a test. A breakout with structure and participation is a trade candidate.
The market logic behind the pattern
Flag pattern stocks work because they compress a common sequence into a recognizable structure:
- Impulse: One side dominates and forces a fast move.
- Pause: Early participants take profits while new traders wait for better prices.
- Resolution: If the original side still has control, price breaks out and resumes the trend.
That doesn't mean every flag works. It means the pattern gives you a framework for reading whether the original pressure still exists.
A junior trader often focuses on appearance alone. A seasoned trader asks a better question. Is this just a pretty channel, or is this a temporary pause after genuine aggression?
That's the difference between spotting shapes and reading tradeable structure.
Identifying Bull Flags and Bear Flags
Most mistakes with flag pattern stocks happen at the identification stage. Traders don't lose because flags never work. They lose because they label too many things as flags.
A valid bull flag and a valid bear flag share the same core idea, but the direction, slope, and trader behavior behind them are different. According to Tradervue's flag pattern overview, bull flags form in uptrends with downward-sloping flags and have shown about a 70% success rate in Bulkowski's analysis, while bear flags form in downtrends with upward-sloping consolidations. The same source notes that flags were formalized by Richard Schabacker in 1932 and became standard through Edwards & Magee's 1948 work, which documented post-breakout rallies averaging 15-20% in post-WWII blue-chip examples.
Bull flag vs Bear flag comparison
| Characteristic | Bull Flag | Bear Flag |
|---|---|---|
| Prior trend | Strong uptrend | Strong downtrend |
| Flag slope | Slightly downward or flat | Slightly upward or flat |
| Breakout direction | Upward | Downward |
| Channel shape | Parallel lines | Parallel lines |
| Market psychology | Profit-taking after a strong rally | Short-covering or bargain buying after a sharp selloff |
| What confirms it | Break above the upper boundary with volume | Break below the lower boundary with volume |
Bull flag checklist
A bull flag should start with a clean upward impulse. Then price should pause in a controlled pullback, not collapse.
Use this checklist:
- Strong prior move: The rally should be obvious and forceful.
- Countertrend pause: The flag should slope slightly down or move sideways.
- Parallel structure: Draw two clean trendlines around the consolidation.
- Contained pullback: Price should look like it's digesting gains, not reversing trend.
- Breakout trigger: The setup becomes actionable only when price clears the upper boundary with real intent.
Bull flags trap traders in two ways. Some traders buy too early because they fear missing the second leg. Others wait so long for "perfect confirmation" that the trade is gone before they act. The solution is rules, not feelings.
Bear flag checklist
Bear flags matter because many traders only study long setups. That's a problem. If you trade indices, forex, or weak individual stocks, you'll see bearish continuation patterns often.
A bear flag usually begins with a hard selloff. Then price rises in a narrow, upward-sloping channel as shorts cover and dip buyers step in too early.
Watch for these conditions:
- Decisive selloff first: The chart should show clear downside pressure before the pause.
- Weak bounce: The consolidation should look corrective, not like a fresh uptrend.
- Parallel lines: The channel needs structure. Random rebounds don't count.
- Breakdown level: The trade only triggers when price breaks lower from the flag.
- Context: A bear flag inside a broader weak market tends to make more sense than one fighting against strong broader strength.
For traders who want a deeper bearish setup breakdown, this guide on the bearish flag pattern is a useful companion.
What separates a clean flag from a fake one
The biggest tell is usually the quality of the consolidation. Clean flags look organized. Weak imitations look noisy, overextended, or too deep.
Use a quick filter:
- Too wide: If the pause swings too much, risk gets worse and conviction drops.
- Too long: A continuation pattern that drags can stop being a continuation pattern.
- Too obvious without confirmation: A textbook shape still needs price and volume to agree.
- Too choppy: If candles keep violating both sides of the channel, the structure is breaking down.
If the flag feels like a fight for control rather than a controlled pause, treat it with caution.
A Rule-Based Strategy for Trading Flags
A tradable pattern is only useful if your execution is mechanical. Pattern recognition without entry rules becomes storytelling. That's where most traders drift into bad trades.
For flag pattern stocks, I want the setup to answer four questions before I do anything. Is the impulse strong enough? Is the consolidation orderly? Is the breakout confirmed? Does the trade fit my risk cap?

According to TrendSpider's guide to flag chart patterns, a strong flagpole in bullish setups is ideally a 15-30% advance over 3-10 bars on daily charts. The same source notes that the consolidation should retrace no more than 38-50% of the flagpole, that volume often contracts 40-60% during the 5-15 bar flag phase, and that breakout volume should surge by 50%+. It also cites Bulkowski's work showing bullish flags achieving 65-75% success rates and notes backtested S&P 500 examples with average measured moves of +17%. Those figures are useful because they push you toward objective filtering instead of loose pattern matching.
If you're not already testing your setups systematically, learn what is backtesting before you put serious size behind any flag strategy.
Entry rules
My default entry is simple. I want a close beyond the boundary of the flag in the direction of the prior move.
For a bull flag:
- Price forms a clear flagpole.
- Consolidation stays within parallel lines.
- The retracement remains controlled relative to the pole.
- Volume contracts during the pause.
- I enter only when a candle closes above the upper trendline.
For a bear flag, flip the logic. The trigger is a close below the lower boundary.
You can choose a more aggressive entry inside the pattern, but understand the trade-off. Earlier entry improves price, but it also increases the chance you're trading before confirmation. Newer traders usually do better waiting for the market to prove the pattern is still valid.
Stop-loss placement
Your stop should sit where the pattern is invalidated, not where the dollar amount feels comfortable.
For a bull flag, that usually means below the low of the flag or below the lower trendline. For a bear flag, it's above the high of the flag or above the upper trendline.
That placement does two things:
- It respects the structure of the pattern.
- It lets you calculate position size from chart logic, not emotion.
Many traders place stops too tight because they want a larger position. That's backwards. If the chart requires a wider stop, either reduce size or skip the trade.
Execution note: A stop-loss doesn't exist to protect your opinion. It exists to prove the setup failed.
Profit target rules
The classic target for flag pattern stocks is the flagpole projection. Measure the height of the pole and project that distance from the breakout point.
That approach works because it keeps the target tied to the original impulse instead of a random round number. It also gives you a consistent framework for comparing setups. If the projected move doesn't justify the risk, the trade may not be worth taking.
I also like to ask one practical question before entry. Does the chart have room to reach that target without immediately running into obvious overhead resistance or support? If the answer is no, the textbook target may be less realistic in that specific setup.
Volume confirmation
Volume is part of the pattern, not a side detail. During a healthy flag, participation should cool off during consolidation and return on the breakout.
That shift tells you the pause may be temporary rather than a true reversal. If price breaks the flag boundary on weak participation, I get skeptical fast. Not every low-volume breakout fails, but enough do that it's worth being selective.
A workable trade checklist
Before placing the order, I want these boxes checked:
- Clear impulse: The flagpole is obvious and not just a minor fluctuation.
- Controlled retracement: The flag doesn't dig too deep into the prior move.
- Parallel channel: The consolidation has structure.
- Volume behavior: Lighter during the flag, stronger on the break.
- Defined invalidation: I know where the setup is wrong before I enter.
- Acceptable reward: The projected target justifies the stop distance.
This is what makes the setup usable in a disciplined environment. You're not trading because the chart looks familiar. You're trading because the structure meets pre-defined conditions.
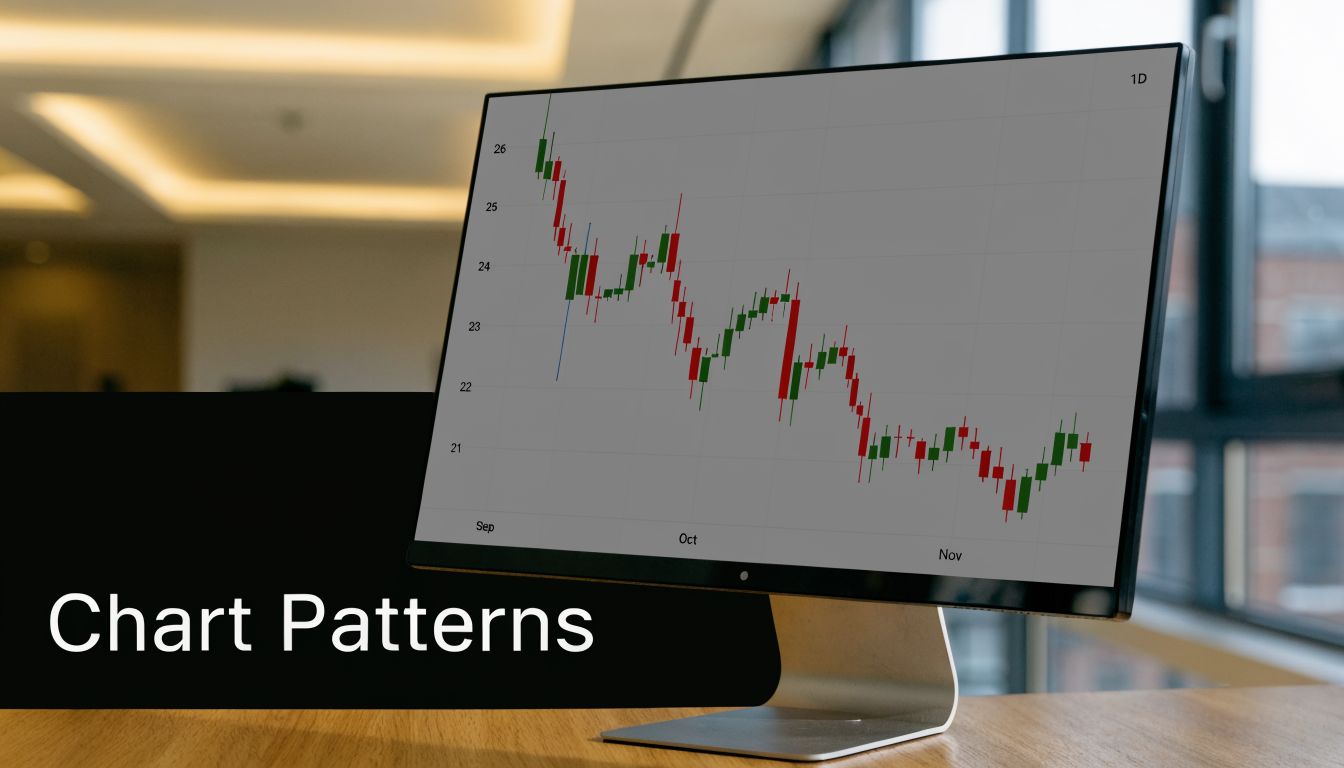
Real World Examples of Flag Pattern Stocks
Charts teach faster than definitions. The key is studying both the setups that work and the ones that tempt you but never confirm properly.
A useful baseline comes from Strike's explanation of flag patterns, which describes flags as short-term continuation formations that typically last one to four weeks. The same source outlines the classic structure: a sharp flagpole on surging volume, a rectangular consolidation with declining volume, and a breakout on renewed high volume. It gives a simple example of a move from $50 to $70, followed by a one-week consolidation between $68 and $72, and notes that volume often drops 50-70% during the flag before expanding again on the breakout. It also cites bull flags succeeding about 70% of the time in bull markets.
Example one the clean bull flag
Start with the textbook case. Price surges hard, then starts drifting lower in a neat channel. Volume fades during the pause. The pullback looks annoying to traders who chased late, but it doesn't damage the prior move.
A disciplined read of that chart looks like this:
- The flagpole is obvious and dominates recent price action.
- The consolidation is short, orderly, and slightly downward sloping.
- The breakout level is easy to mark.
- The stop can sit under the flag structure without guesswork.
This is the setup that tends to attract momentum traders after the breakout candle closes. It isn't cheap anymore, but it's confirmed. In active trading, confirmed often beats early.
Example two the bear flag that keeps traders trapped
The best bear flags usually show up after a sharp flush when traders start calling a bottom too soon. Price bounces, but the bounce is narrow and labored. It moves up, but it doesn't look healthy.
What I want to see on that chart:
| Element | What a trader should look for |
|---|---|
| Initial move | A hard selloff with clear downside pressure |
| Bounce quality | Tight, upward-sloping, and corrective |
| Channel structure | Parallel boundaries that define the flag |
| Trigger | A clean break lower from the channel |
| Trade management | Stop above the flag, target based on measured move |
This kind of setup punishes traders who confuse relief with reversal. That's a recurring lesson in weak stocks and weak market sessions.
Example three the failed flag
A failed flag teaches more than a successful one. The pattern often looks close enough to tempt you, but one or two details are off.
Common warning signs include:
- Loose structure: Candles keep poking outside the channel.
- Overlong pause: The consolidation drags and loses its continuation character.
- Weak breakout attempt: Price pushes the boundary but doesn't attract follow-through.
- Messy context: Broader market conditions don't support continuation.
When a flag fails, the mistake usually happened before the loss. The trader either forced the pattern, entered before confirmation, or ignored that the market wasn't trending cleanly enough for continuation setups.
A failed flag isn't proof that the pattern doesn't work. It's proof that selective traders and impulsive traders are not taking the same trade.
How to study examples properly
Don't just scroll and say, "I see it now." That's hindsight. Mark the chart bar by bar and decide where you would've entered, where your stop would've gone, and whether the pattern was valid before the breakout.
That process matters more than collecting screenshots. The goal isn't to recognize perfect examples after the fact. The goal is to make better decisions when the right edge of the chart is still blank.
Common Pitfalls and Advanced Implementation
Most traders don't misuse flag pattern stocks because they lack information. They misuse them because they rush the process.
What not to do
The fastest way to ruin a decent setup is to force a label onto random price action. If you're determined to find a flag on every chart, you'll find one. It just won't be a tradeable one.
Avoid these errors:
- Forcing the pattern: Not every channel after a move is a flag.
- Ignoring context: Continuation setups work better when the broader market is trending.
- Buying the middle: Entering before the breakout leaves you exposed to more noise.
- Chasing late: If price is already extended well beyond the trigger, your risk-reward often deteriorates.
- Treating volume as optional: A clean shape without participation is weaker than many traders admit.
A lot of beginners think the hard part is spotting the setup. It isn't. The hard part is skipping the setups that almost qualify.
Advanced implementation ideas
Once your discretionary read is consistent, move into structured review. Backtest the pattern across the markets and timeframes you trade. Don't test every possible variation. Test the exact rules you intend to follow.
Useful variables to review include:
- breakout candle quality
- depth of retracement
- time spent in consolidation
- broader trend alignment
- performance by market session or instrument type
From there, you can translate the setup into code logic. An algorithm doesn't "see" a flag the way you do, so you need clear definitions. Prior impulse, channel boundaries, retracement threshold, breakout condition, and invalidation level all need objective rules.
Multi-timeframe confirmation
A flag can look excellent on one timeframe and mediocre on another. That's why I like to use higher timeframe context and lower timeframe execution.
The higher timeframe answers whether the trend is worth following. The lower timeframe helps refine the trigger and stop placement. This doesn't mean stacking endless indicators. It means making sure the setup isn't fighting obvious structure one level up.
Clean execution often comes from fewer decisions, not more indicators.
Trading Flags Within Prop Firm Rules
A flag setup fits prop trading well because the structure naturally defines entry, stop, and target. That's exactly what you need when your risk is capped and your margin for error is small.

The trap is obvious. A trader sees a clean flag, feels confident, and sizes too aggressively because the stop looks tight. Then a normal failed breakout turns into unnecessary damage.
How to adapt the setup to prop-style limits
The solution is boring but effective:
- Start with the invalidation point: The chart tells you where the trade is wrong.
- Calculate size from the stop distance: Position size comes after structure, not before.
- Cap your exposure early: One idea should never put your daily loss limit under pressure.
- Avoid stacking correlated flags: Multiple positions in the same market theme can behave like one oversized trade.
This matters under evaluation and funded-account conditions. If your rules include a fixed daily loss limit and a maximum drawdown cap, a continuation setup with clearly defined structure is easier to manage than a reactive, discretionary chase.
One practical reference point is the prop firms challenge, where traders work within defined limits and need consistency more than occasional big wins. MyFundedCapital is one firm built around that model, with simulated-capital evaluations and clear drawdown parameters, which makes structured setups like flags easier to plan around.
The real edge inside prop trading
The pattern itself isn't the edge. The edge comes from taking only the clean versions, risking small relative to your daily limit, and not forcing action when the market is messy.
In that environment, flags do something useful. They slow you down. They make you wait for the market to pause, define the range, and show its hand.
That's a better fit for professional risk control than emotional breakout chasing.
Frequently Asked Questions About Flag Patterns
How long should a flag pattern last
A typical flag is a short-term continuation pattern, not a long base. If consolidation drags too long, the setup becomes less convincing. In practice, shorter and cleaner is usually better than longer and sloppier.
Are flag pattern stocks only for day traders
No. Traders use flags on intraday charts, daily charts, and sometimes weekly charts. The pattern logic stays the same. What changes is your holding period, stop distance, and the amount of patience required.
Should I enter on the breakout or wait for a retest
Both approaches can work. Breakout entries give you confirmation sooner. Retest entries can improve price and tighten risk, but not every valid breakout retests cleanly. If you're newer, taking the confirmed breakout is often simpler than waiting for a perfect second chance.
What makes a flag invalid
Several things can weaken or invalidate the setup:
- No real flagpole: Without a strong impulse, there is no continuation context.
- Messy consolidation: If the channel is loose and inconsistent, the structure is weaker.
- Deep retracement: A flag that gives back too much of the prior move starts looking more like reversal pressure.
- Weak breakout: If price leaves the pattern without conviction, follow-through becomes less reliable.
Are flags better than pennants or wedges
Not better in every situation. They are different. A flag has parallel boundaries and usually represents a controlled pause. Pennants and wedges have different shapes and often reflect different market behavior. What matters most is whether you can identify the structure accurately and trade it with rules.
Do I need indicators to trade flags
No, but indicators can help if they support your process instead of replacing it. Price structure comes first. Volume, moving averages, or broader trend tools can help confirm context, but they shouldn't be used to justify a weak pattern.
Start Trading With a Disciplined Edge
Flag pattern stocks reward patience more than aggression. The traders who handle them well aren't predicting. They're waiting for a strong move, a controlled pause, and a confirmed resolution, then managing risk without ego.
That's the right mindset whether you're trading your own account or trying to earn access to larger capital. Keep your process tight. Review your charts. Track what clean setups look like in your market. If you want another practical trading resource in your rotation, the Digest Invest By Etoro podcast is worth exploring for broader market perspective.
Trading involves risk of loss. This article is educational only and not financial advice.
If you're ready to apply a disciplined setup in a professional-style environment, explore the funding options at MyFundedCapital, compare account types, and start a challenge that fits your trading approach.