Feeling a step behind the market, missing strong trends, or getting caught in reversals is a common frustration for traders. The Commodity Channel Index (CCI) indicator is a classic tool designed to tackle this challenge. In this guide, you'll learn what the CCI is, how to interpret its signals, and practical strategies to apply it to your trading.
What Is the Commodity Channel Index and How Does It Work
At its core, the Commodity Channel Index is a versatile indicator that helps you identify emerging trends and gauge momentum. Think of it as a way to see if the current price is "normal" or if it's deviating significantly from its recent behavior.
When the CCI line surges to high levels, it’s telling you that the price is trading well above its recent average—a sign of strong bullish momentum. Conversely, when it plunges to low levels, the price is far below its average, signaling powerful bearish momentum. This measurement is the key to its effectiveness, but remember that trading involves risk, and this tool offers no guarantees.
The Origins and Mechanics of the CCI
The CCI was developed by Donald Lambert in 1980, originally to spot cyclical turns in commodity markets. Traders quickly adapted it for forex, stocks, and crypto due to its versatility.
Lambert’s formula includes a constant (0.015) that calibrates the indicator so that roughly 70-80% of all CCI values fall between the -100 and +100 levels on a standard 20-period setting. This design makes it immediately obvious when price action is becoming unusually strong or weak.
Unlike oscillators like the RSI, the CCI is unbounded—it has no "ceiling" or "floor." This unique trait allows it to reflect extreme momentum without getting capped, which is incredibly useful in powerful, runaway trends.
Interpreting CCI Signals Like a Pro
Getting the hang of the Commodity Channel Index isn't about memorizing a formula. It's about learning to speak its language—understanding what the oscillator is trying to tell you about the market's real-time momentum.
A common mistake is to see a high CCI reading, assume the market is "overbought," and look for a place to sell. This is a classic misinterpretation because the CCI is a momentum indicator, not a reversal predictor.
Decoding the Core Levels
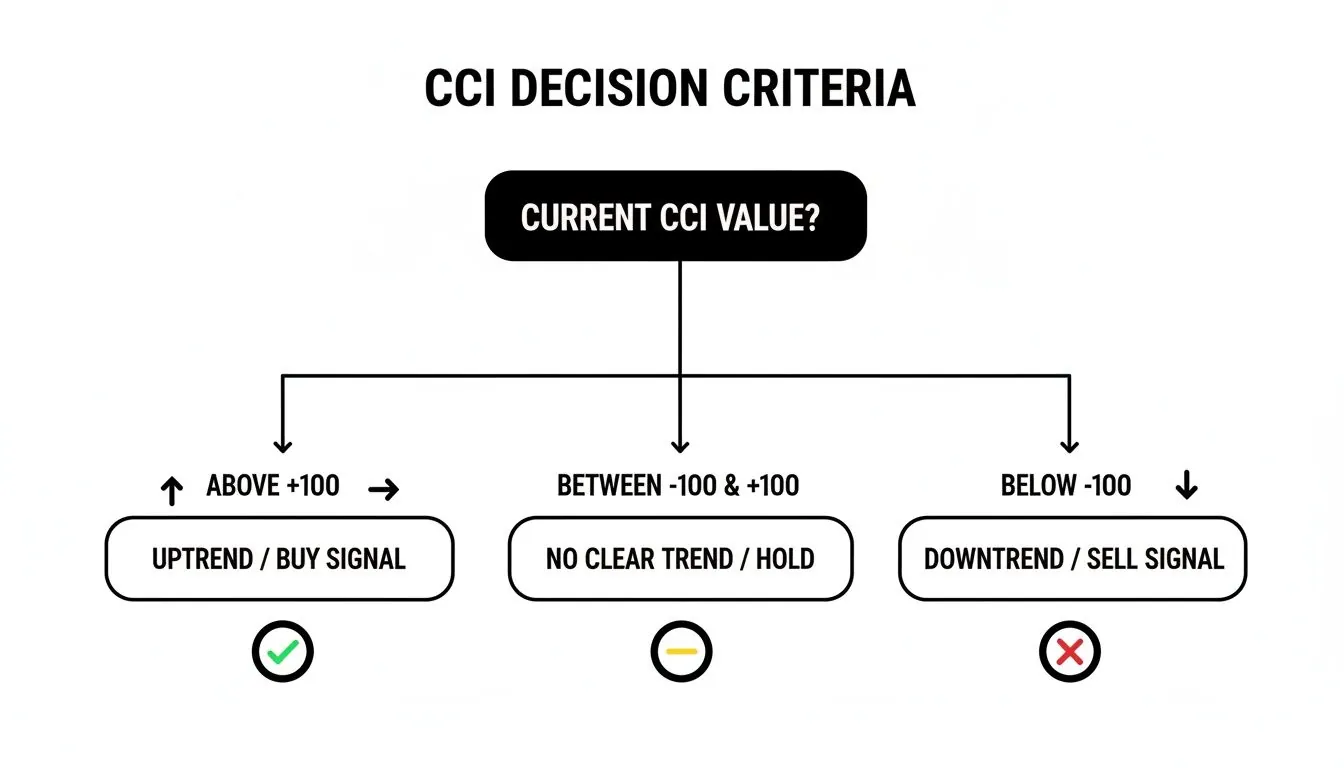
To read the CCI correctly, you need to focus on three key signposts: +100, -100, and the zero line. Think of these not as rigid barriers but as zones that tell a story about the market's current energy.
- Above +100: When the CCI pushes past +100, it signals a strong uptrend with serious bullish momentum. In a healthy trend, the CCI can remain in this zone, so don't be quick to call a top.
- Below -100: A drop below -100 marks a strong downtrend fueled by powerful bearish momentum. An asset can stay in this "oversold" state as long as the downward trend has legs.
- The Zero Line: This line is the battlefield between bulls and bears. When the CCI crosses up through zero, it suggests bullish momentum is gaining the upper hand. When it slices down through zero, it’s a sign the bears are taking control.
A crucial mental shift is to see "overbought" as a sign of a strong uptrend and "oversold" as a sign of a strong downtrend. Don't mistake strength for an automatic reversal.
The Overbought and Oversold Myth
The terms "overbought" and "oversold" often cause more harm than good for new CCI users. A better way to frame it is as a measure of statistical extremity. The indicator simply shows how far the current price has deviated from its recent "normal" behavior.
In a market that's trending hard, you should expect to see these extreme readings. An uptrend is supposed to make new highs, and the CCI will reflect that strength. A trader trying to short that strength will likely get run over, while a trend-follower sees it as confirmation to hold their long position.
Actionable CCI Trading Strategies
Now let's move past theory and into practical application. Here are three distinct CCI strategies with clear rules for entry, exit, and risk management. These are not guaranteed profit systems; they are frameworks to test and adapt. Always be transparent about risks and remember that all trading involves the risk of loss.
This flowchart gives you a simple decision-making map for the CCI's main signals.
Strategy 1: The Overbought/Oversold Reversal
This is a counter-trend play with a strict rule: never short a market just because the CCI is above +100 or buy just because it's below -100. Instead, wait for confirmation that momentum is actually turning.
- Step 1: Spot the Extreme: Wait for the CCI to push past +100 (for a potential sell) or dip below -100 (for a potential buy).
- Step 2: Wait for the Hook: The entry trigger is the CCI crossing back inside the range. For a short trade, wait for the CCI to drop back below +100. For a long trade, wait for it to climb back above -100.
- Step 3: Get Confirmation: Look for a confirming candlestick pattern, like a bearish engulfing candle for a short or a bullish pin bar for a long.
- Risk Management: Place a stop-loss just above the recent swing high (for shorts) or below the swing low (for longs). An initial profit target could be the zero line.
Strategy 2: The Zero-Line Cross for Trend Following
This strategy is about joining a new trend as it gathers steam. The zero line acts as a momentum switch.
- Bullish Entry (Long): Enter when the CCI crosses from negative territory to positive (from below zero to above it). This signals that bulls are taking control. An entry on the close of the crossover candle is a common approach.
- Bearish Entry (Short): Enter when the CCI crosses from positive territory to negative (from above zero to below it). This indicates bears are taking charge.
- Example: If EUR/USD has been consolidating and its CCI crosses above the zero line on the 1-hour chart, a trend-following trader might enter a long position with a stop-loss below the recent consolidation low.
This strategy works well when a market is breaking out of a range. To filter out noise, combine the zero cross with another signal, like a moving average crossover. For more ideas, learn how to create a forex strategy based on technical analysis.
Strategy 3: CCI Divergence Trading
Divergence is one of the most powerful signals from the Commodity Channel Index indicator. It occurs when price and the indicator tell different stories, suggesting the underlying trend is losing steam.
- Bearish Divergence: Price makes a higher high, but the CCI makes a lower high. This is a classic sign that buying pressure is fading.
- Bullish Divergence: Price makes a lower low, but the CCI carves out a higher low. This hints that sellers are getting exhausted and a bottom may be forming.
- Example: If Bitcoin makes a new high at $70,000 but the CCI on the daily chart prints a lower high than it did at the previous peak of $68,000, this bearish divergence could be an early warning for long-position holders to tighten their stops or take some profit.
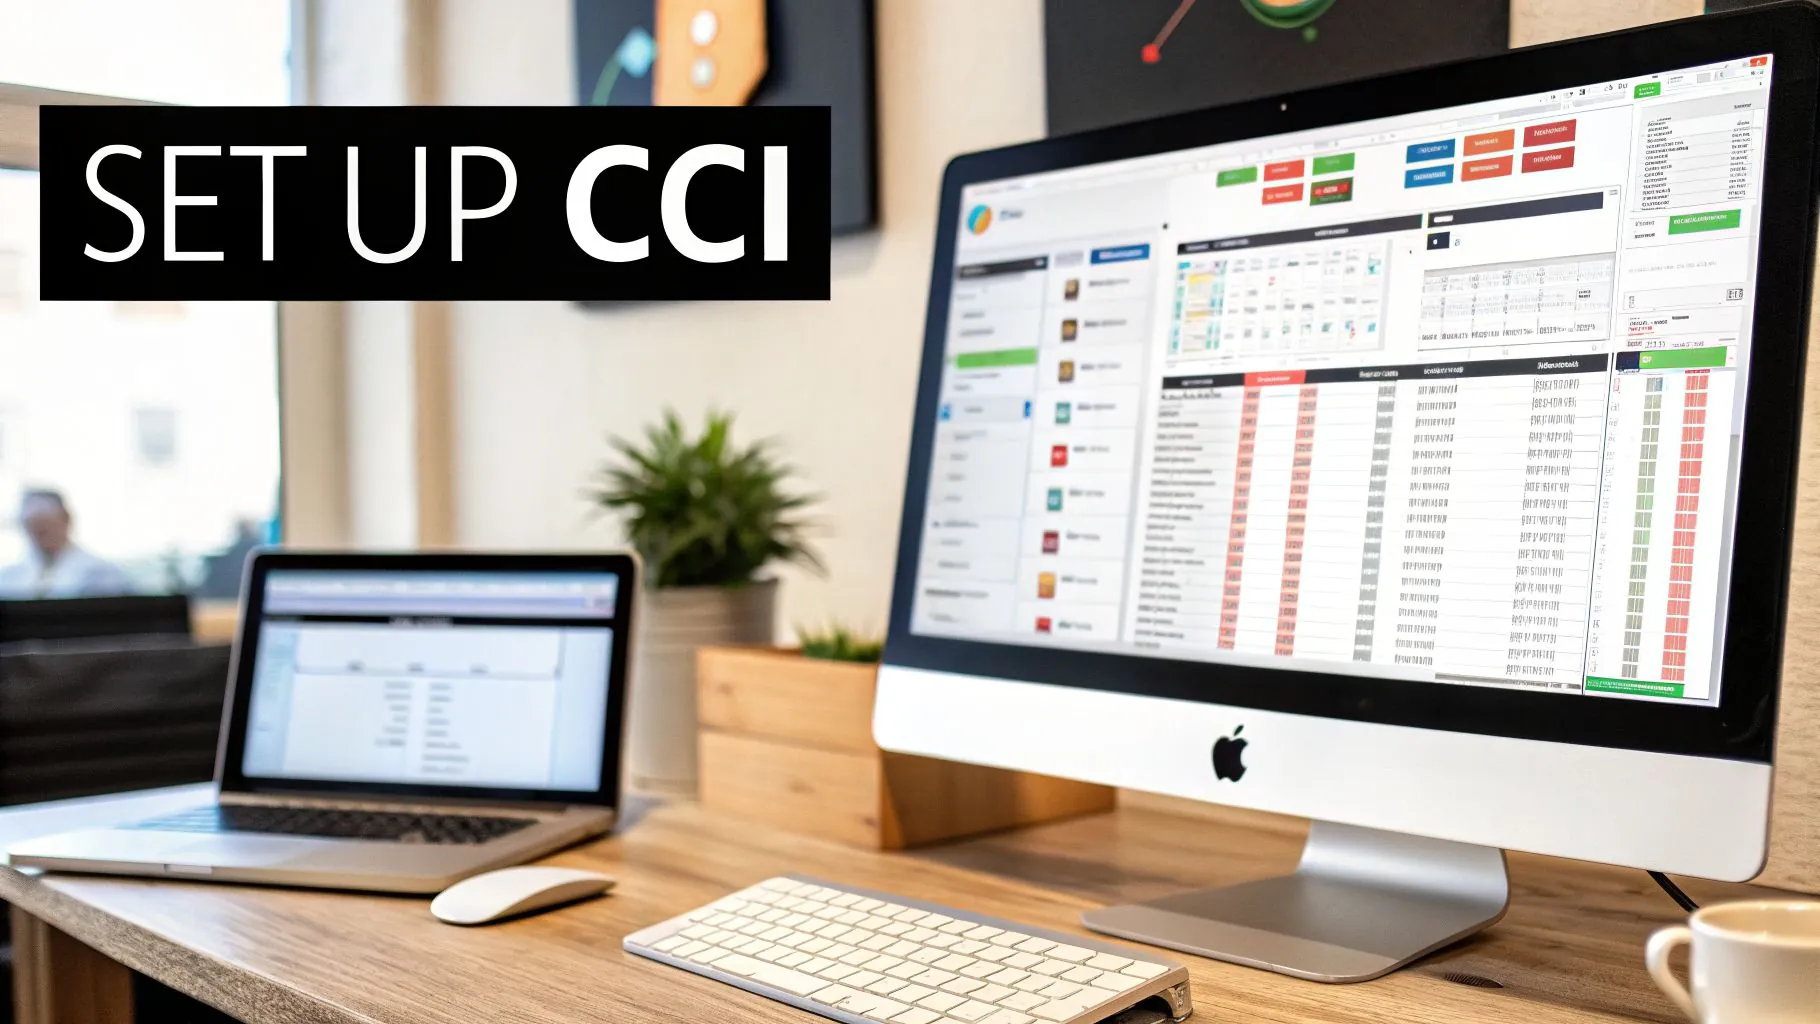
How to Set Up the CCI on cTrader, DXtrade, and Match-Trader
Let's get practical and walk through adding the Commodity Channel Index (CCI) on platforms you can use for our funding challenges: cTrader, DXtrade, and Match-Trader.
Setting Up the CCI on cTrader
- Open Your Chart: Pull up the chart for the asset you’re watching.
- Find the Indicators Menu: Look for the "Indicators" icon (f(x)) in the top toolbar or right-click the chart.
- Search for CCI: In the indicator list, type "CCI" into the search bar and select "Commodity Channel Index."
- Apply and Tweak: The CCI will appear below your price chart. Click the settings icon (a small gear) next to the indicator's name to change the Period (default is 20) and adjust the line colors.
Configuring the CCI on DXtrade and Match-Trader
The process is very similar on both platforms.
- Locate the Indicator List: Look for an "Indicators" button in the main charting toolbar.
- Search and Add: Use the search function to find the "Commodity Channel Index" and add it to your chart.
- Access Settings: Right-click the indicator line or find a settings icon to access its parameters and adjust the period.
Fine-Tuning the CCI Period Setting
There’s no magic number for the CCI period. The default is 20, but you should tweak it to fit your trading style.
- Shorter Periods (e.g., 10-14): Makes the CCI react faster to price changes. Good for day traders and scalpers.
- Longer Periods (e.g., 50-100): Smooths out noise and focuses on the primary trend. Better for swing and position traders.
Spend time experimenting on your charts to see which period best highlights the trends you're trying to capture.
Advanced Risk Management with the CCI Indicator
Using the CCI to actively manage risk is what separates consistent traders from the rest. This is especially true when trading a funded account with strict rules like daily drawdown limits. This content is educational only and not financial advice.
Using Multi-Timeframe Analysis for Trend Confirmation
One of the most effective ways to filter out weak trades is by making sure signals line up across different timeframes.
- Define the Primary Trend: On a daily chart, add a long-period CCI, like a CCI(50). If it's above the zero line, the main trend is bullish. If it's below zero, the trend is bearish.
- Look for High-Probability Entries: Drop down to a shorter timeframe (e.g., 1-hour chart) with a standard CCI(20). Only take trades that agree with the daily trend. If the daily trend is bullish, wait for the hourly CCI to dip below -100 and hook back up—a classic "buy the dip" signal.
- Filter Out Counter-Trend Noise: If the daily CCI signals a strong uptrend, you must ignore any bearish signals on the hourly chart. This discipline keeps you from fighting the market, a costly mistake.
Combining the CCI with Other Indicators
The CCI is more reliable when paired with other indicators for confirmation. A classic combination is the CCI with a moving average (MA).
For example, add a 200-period Exponential Moving Average (EMA) to your chart. A high-quality bullish entry would meet these criteria:
- The price is trading above the 200 EMA (confirming the long-term uptrend).
- The daily CCI(50) is above the zero line (confirming intermediate momentum).
- The hourly CCI(20) crosses back above -100 (providing the precise entry trigger).
When you get this trifecta of signals, the probability of the trade succeeding increases significantly. This layered approach is a hallmark of professional trading. You can learn more in our guide to risk management in Forex trading.
Frequently Asked Questions about the CCI Indicator
What is the best period setting for the Commodity Channel Index CCI indicator?
There's no single "best" setting. It depends entirely on your trading style.
- Day Traders: A shorter period, like 14, makes the indicator more sensitive for catching quick intraday moves.
- Swing Traders: A longer period, like 50, helps smooth out noise and focus on the primary trend.
The best approach is to experiment on your charts to see which setting works for your strategy.
How is the CCI different from the RSI?
Both are momentum oscillators, but they measure different things. The RSI is "bounded" between 0 and 100, measuring the speed and change of price movements. The CCI is "unbounded," measuring the current price level relative to an average price level over a specific period. This unbounded nature allows the CCI to show extreme momentum more effectively than the RSI, which can get "stuck" at high or low levels during strong trends.
What are the biggest mistakes to avoid when using the CCI?
The costliest mistakes come from misinterpretation. Avoid these common traps:
- Trading it in Isolation: Never use the CCI as a standalone signal. Always confirm its signals with price action, support/resistance levels, or other indicators.
- Fading Strong Trends: Do not automatically sell just because the CCI is above +100. In a strong trend, a market can remain "overbought" for a long time.
- Ignoring Divergence: Divergence is a powerful signal that a trend may be weakening. Ignoring it means you could be missing high-probability reversal setups.
Ready to apply your knowledge of the Commodity Channel Index CCI indicator? Test your strategies and discipline with a MyFundedCapital funding challenge. Pass the evaluation, prove your edge, and get funded.
Compare our Instant Funding, 1-Step, and 2-Step programs to find the right fit for you.