Knowing how to calculate your profit and loss (P&L) is essential for any serious trader, but many overlook the crucial details that impact their bottom line. This guide breaks down the exact formulas for Forex, indices, and crypto, showing you how to account for hidden costs like commissions and swaps. You'll learn the practical steps to manage risk and meet the strict rules of prop firm challenges.
Why You Can't Afford to Eyeball Your P&L
The moment you decide to trade seriously, you're running a business. And what does every business need? Clean books. Your P&L statement is the ultimate scorecard, showing you what’s working, what’s bleeding you dry, and where your money is actually going.
If you aren't calculating your P&L accurately, you’re flying blind and making decisions based on gut feelings, not hard data. The process goes beyond just subtracting your entry from your exit price; it's a detailed breakdown of every single variable that hits your bottom line. Getting this right is the engine behind solid risk management and smart strategic planning. Remember, trading involves significant risk of loss and is not suitable for all investors.
The Bedrock of Smart Trading Decisions
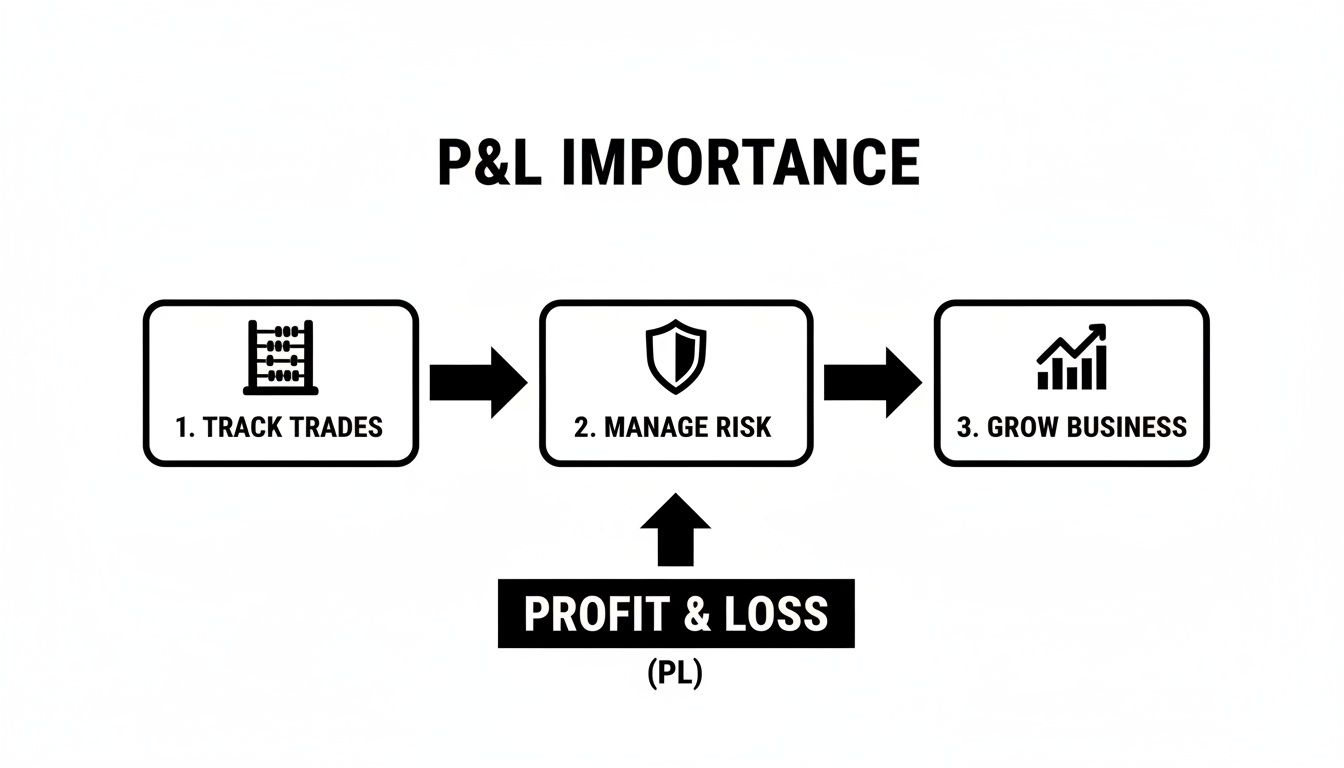
Every profitable trading strategy is built on a crystal-clear understanding of its financial results. When you track your P&L with precision, you start seeing the patterns in your own trading.
- Is Your Strategy Actually Working? Meticulous P&L tracking gives you objective proof of whether your system is profitable long-term. A few big wins feel great, but only the net P&L tells the real story.
- Sharpening Your Risk Management: Knowing your exact gain or loss on past trades helps you set realistic risk parameters for the next one. It’s how you ensure one bad trade doesn’t blow up your account.
- Surviving in the Prop Firm World: For aspiring funded traders, this isn't optional; it's a survival skill. Drawdown limits are razor-thin, and a simple miscalculation can get your account shut down.
To put this in a broader business context, it's helpful to understand the difference between P&L and Balance Sheet. One shows your performance over a period, while the other is a snapshot of your financial health at a single moment.
Key Components for P&L Calculation
Before we jump into the formulas, let's break down the core ingredients. Miss one, and you get a skewed picture of your performance. Here’s a quick rundown of the essential variables you'll need for any trade calculation.
| Component | Description | Why It Matters |
|---|---|---|
| Entry & Exit Price | The prices where you opened and closed your trade. | This forms the basis of your gross profit or loss before any other costs are factored in. |
| Position Size | The total value of your position (e.g., number of lots, contracts). | This dictates the dollar value of each pip or point move, magnifying both your wins and losses. |
| Trading Costs | All the fees: commissions, swaps, and slippage. | These are direct costs that eat into your gross profit and must be subtracted to find your true net P&L. |
| Currency Conversion | Changing the P&L from the asset's currency into your account's base currency. | This step ensures the final number accurately reflects how the trade impacted your actual account balance. |
Think of these as the non-negotiable inputs. Once you have a handle on them, calculating your exact P&L for any trade becomes a straightforward process.
Calculating P&L in Forex Using Pip Values
In the world of forex, every tick up or down is measured in pips—short for "percentage in point." Your main job as a trader is to translate those tiny pip movements into real dollars and cents in your account.
The final profit or loss depends entirely on the currency pair you're trading, how large your position is, and what your account's base currency is. A 50-pip gain might be $50 on one trade but a massive $500 on another. It all comes down to the math behind the position.
Demystifying Pip Value Calculations
The value of a pip is determined by the quote currency (the second one in a pair, like JPY in USD/JPY), but what we really care about is what that pip is worth in our own account currency—usually USD, EUR, or GBP.
Let's break down the formula for a standard lot, which is 100,000 units of the base currency.
- For pairs where USD is the quote currency (like EUR/USD or GBP/USD): The pip value is fixed. One pip is always worth $10 on a standard lot.
- For pairs where USD is the base currency (like USD/JPY or USD/CHF): The formula is: (Pip Size / Exchange Rate) * Lot Size.
- For cross-currency pairs (like EUR/JPY or GBP/AUD): The formula is more complex: [(Pip Size * Base Currency Exchange Rate) / Cross Pair Exchange Rate] * Lot Size.
While it's good to know the mechanics, modern trading platforms handle this for you. Smart traders use tools like a lot size calculator to get a quick, accurate read on potential P&L before placing the trade.
Precise trade tracking isn't just about bookkeeping; it's the bedrock of solid risk management and growing your account sustainably.
Practical Examples of Forex P&L Calculation
Theory is great, but let's see how this plays out with real numbers. Here are a couple of common trading scenarios for a USD-based account.
Example 1: Long on EUR/USD
Let's say you buy 0.50 lots of EUR/USD at 1.07250 and close the trade at 1.07750.
- Pips Gained: 1.07750 – 1.07250 = 0.00500, which is 50 pips.
- Pip Value for EUR/USD (Standard Lot): This is a fixed $10.
- Your Pip Value (0.50 Lots): 0.50 lots * $10 = $5 per pip.
- Gross Profit: 50 pips * $5/pip = $250.
Example 2: Short on USD/JPY
Now for a trickier one. You sell 1 standard lot of USD/JPY at 157.40 and exit at 156.90.
- Pips Gained: 157.40 – 156.90 = 0.50, or 50 pips.
- Pip Value Formula: (0.01 / Exit Exchange Rate) * Lot Size.
- Calculation: (0.01 / 156.90) * 100,000 = $6.37 per pip.
- Gross Profit: 50 pips * $6.37/pip = $318.50.
The pip value for USD/JPY isn't a neat, round number like $10. It fluctuates with the pair's exchange rate—a crucial detail many traders overlook.
The Final Step: Currency Conversion
What if you're trading a pair where neither currency matches your account's currency, like trading GBP/JPY from a USD account? Your trading platform handles this automatically. It will calculate your profit in the quote currency (in this case, JPY) and then convert it back into your account's base currency (USD) at the prevailing exchange rate. While it happens behind the scenes, understanding this process gives you a true, granular view of where your P&L comes from.
P&L Beyond Forex: Indices, Metals, and Crypto
While forex traders live and breathe pips, the game changes when you step into other markets. To accurately track your performance, you have to shift your thinking from pips to points for indices, ticks and dollar moves for metals, and the direct price value for crypto. Each asset class has its own quirks.
How to Calculate P&L for Indices
When you trade an index like the US30 (Dow Jones), you're tracking its movement in points. The formula is straightforward:
P&L = (Exit Price – Entry Price) x Point Value x Contract Size
Example: A Long Trade on US30
Imagine you buy 2 contracts of the US30 at 39,500 and take profit at 39,580. On most standard contracts, one point of movement is worth $1.
- Points Gained: 39,580 – 39,500 = 80 points
- Value per Point: $1
- Number of Contracts: 2
- Gross Profit: 80 points x $1/point x 2 contracts = $160
The most important thing is to know the dollar value per point for the specific index and contract you're trading, as it can vary.
Calculating P&L for Precious Metals
For metals like Gold (XAU/USD), your P&L is based on the price movement multiplied by your position size in ounces. A standard contract for Gold is 100 troy ounces.
Here's a handy shortcut: For a standard lot of Gold (100 oz), every $1 move in the price equals a $100 profit or loss.
Example: A Short Trade on Gold (XAU/USD)
Let's say you sell 1 standard lot of Gold at $2,350.50 and close the trade at $2,340.00.
- Price Difference: $2,350.50 – $2,340.00 = $10.50
- Position Size: 100 ounces (1 standard lot)
- Gross Profit: $10.50 price change x 100 ounces = $1,050
P&L calculations aren't just for derivatives; traders in other markets also need to figure out their gains, such as by learning the methods for calculating Capital Gains Tax on Shares.
Understanding Crypto P&L Calculations
Cryptocurrencies like Bitcoin (BTC/USD) are perhaps the most intuitive to calculate. The formula is as simple as it gets:
P&L = (Exit Price – Entry Price) x Quantity of Coins
Example: Buying BTC/USD
You buy 0.10 Bitcoin when the price is $68,000 and sell at $70,500.
- Price Change per Coin: $70,500 – $68,000 = $2,500
- Quantity Traded: 0.10 BTC
- Gross Profit: $2,500 x 0.10 = $250
Your P&L is a direct reflection of the change in the U.S. dollar value of your crypto. While the math is easy, remember that crypto's notorious volatility means profits and losses can stack up extremely fast.
Getting Real About Your P&L: Commissions, Swaps, and Slippage
The P&L you see on your screen when you close a trade isn't what actually hits your account. That initial figure is your gross P&L. To understand your real performance, you must subtract the costs of doing business: commissions, swaps, and the silent profit-killer, slippage. These expenses can easily turn a winning strategy into a losing one over time.
The Cost of a Ticket: Factoring in Commissions
Commissions are the fee for getting your order executed, charged for both opening and closing a trade. A standard commission might be $3.50 per lot, per side, making the total round-trip cost for a 1-lot position $7.00.
- You go long on 1 standard lot of EUR/USD and your gross profit is $150.
- The round-trip commission is $7.00.
- Your Net Profit is actually: $150 (Gross) – $7.00 (Commission) = $143.00.
This is a fixed cost you have to beat just to break even.
The Price of Holding: Understanding Overnight Swaps
If you hold a leveraged trade past the market close, you'll encounter a swap fee (or financing fee). This is based on the interest rate difference between the two currencies you're trading (for FX) or the cost of financing for other CFDs. Swaps are typically a cost and are tripled on Wednesdays to cover the upcoming weekend. For every night you hold a position, you need to subtract that cost from your gross P&L. A proper stop loss and take profit strategy can help keep these holding costs in check.
The Unseen Thief: The Hidden Cost of Slippage
Slippage is the gap between the price you clicked and the price you got. It's most common during high-impact news events when the market jumps over your intended price. While you can occasionally get positive slippage (a better price), it's far more common to experience negative slippage. For example, a stop-loss set at 1.08500 might get filled at 1.08495, and that 0.5-pip difference comes directly out of your bottom line.
In the world of prop firm trading, these "small" costs are everything. Ignoring them is a recipe for failure.
Applying P&L Math to Prop Firm Drawdown Rules
In proprietary trading, calculating your profit and loss is a survival skill. Every trade is measured against unforgiving drawdown rules, and one miscalculation can knock you out of the game. You must know—in real-time—how much breathing room you have before hitting a daily or maximum loss limit.
Translating Drawdown Rules into Hard Numbers
Let's use a standard $100,000 challenge account as a practical example.
Most prop firms enforce rules like these:
- Maximum Daily Loss: A hard 5% limit on how much your account can lose in a single trading day.
- Maximum Overall Drawdown: A 10% limit on the total loss from your initial balance.
For a $100,000 account, these percentages translate into:
- Daily Loss Limit: $100,000 x 5% = $5,000.
- Max Drawdown Limit: $100,000 x 10% = $10,000 (your account cannot fall to $90,000).
These are bright red lines you cannot cross. Understanding your P&L isn't just about chasing profit; it's about meticulously protecting your account from these thresholds. For traders dealing with more complex rules, like a trailing drawdown, the details become even more critical. Our guide explains what is trailing drawdown and how it differs from a static limit.
Pre-Calculating Your Risk on Every Single Trade
Before you ever click "buy" or "sell," you must know your "if-wrong" number—the exact amount you stand to lose. This means calculating your potential loss based on your position size and where you place your stop-loss.
Let's say your $100k account has a balance of $102,000. Your daily loss limit is 5% of your previous day's balance, which is $5,100. You take a trade that goes against you, creating a floating loss of $2,000. You now have just $3,100 of buffer left for the day.
You see another setup on Gold (XAU/USD). Here’s the thought process:
- Define Your Stop-Loss: You decide your trade is invalid if Gold moves $10 against your entry.
- Calculate Position Size: A $10 stop-loss on one standard lot of Gold represents a $1,000 loss.
- Check Against Your Limit: A 1 lot position would result in a $1,000 loss if stopped out, bringing your total daily drawdown to $3,000. A 3 lot position would mean a $3,000 loss, pushing your total to $5,000—dangerously close to your $5,100 limit.
This pre-trade calculation is the single most important habit a prop firm trader can develop. It forces you to respect the rules and ensures no single trade can torpedo your challenge. This discipline is what separates the few who get funded from the many who fail. This content is for educational purposes only and should not be considered financial advice.
FAQ: Your P&L Questions Answered
What's the difference between Gross and Net P&L?
Gross P&L is the raw profit or loss from your entry to your exit price. Net P&L is the final amount after deducting all trading costs, including commissions, swap fees, and slippage. Net P&L is the only figure that truly reflects your trading performance and the actual change in your account balance.
How do I calculate my P&L as a percentage?
Calculating P&L as a percentage helps you measure performance consistently, regardless of account size. The formula is simple: (Net P&L in Dollars / Your Account Balance) * 100. For example, a $500 net profit on a $50,000 account is a 1% gain. Thinking in percentages helps maintain consistent risk management.
Should I calculate P&L manually if my platform does it?
Yes. While your platform automates the process, calculating your potential profit and loss manually before placing a trade is a crucial habit. It helps you proactively plan your risk, determine the correct position size, and verify that your broker's fees are correct. This practice makes the risk tangible and is your best defense against accidentally breaching prop firm drawdown limits.
Ready to put your P&L management skills to the test? At MyFundedCapital, we provide the platform and funding for disciplined traders to prove their edge.
Explore our funding programs and start your challenge today.