

 AR
AR
 NL
NL
 FR
FR
 DE
DE
 ES
ES
 IT
IT
 PL
PL
 SV
SV
 PT
PT

Learning to read candlestick charts can feel overwhelming, but some patterns offer clear, actionable signals. The inside bar pattern is one of them, indicating a brief pause in market momentum that often precedes a significant move. This guide will teach you how to identify high-probability inside bar setups, apply practical trading strategies, and manage risk effectively.
What The Inside Bar Pattern Reveals About Market Psychology
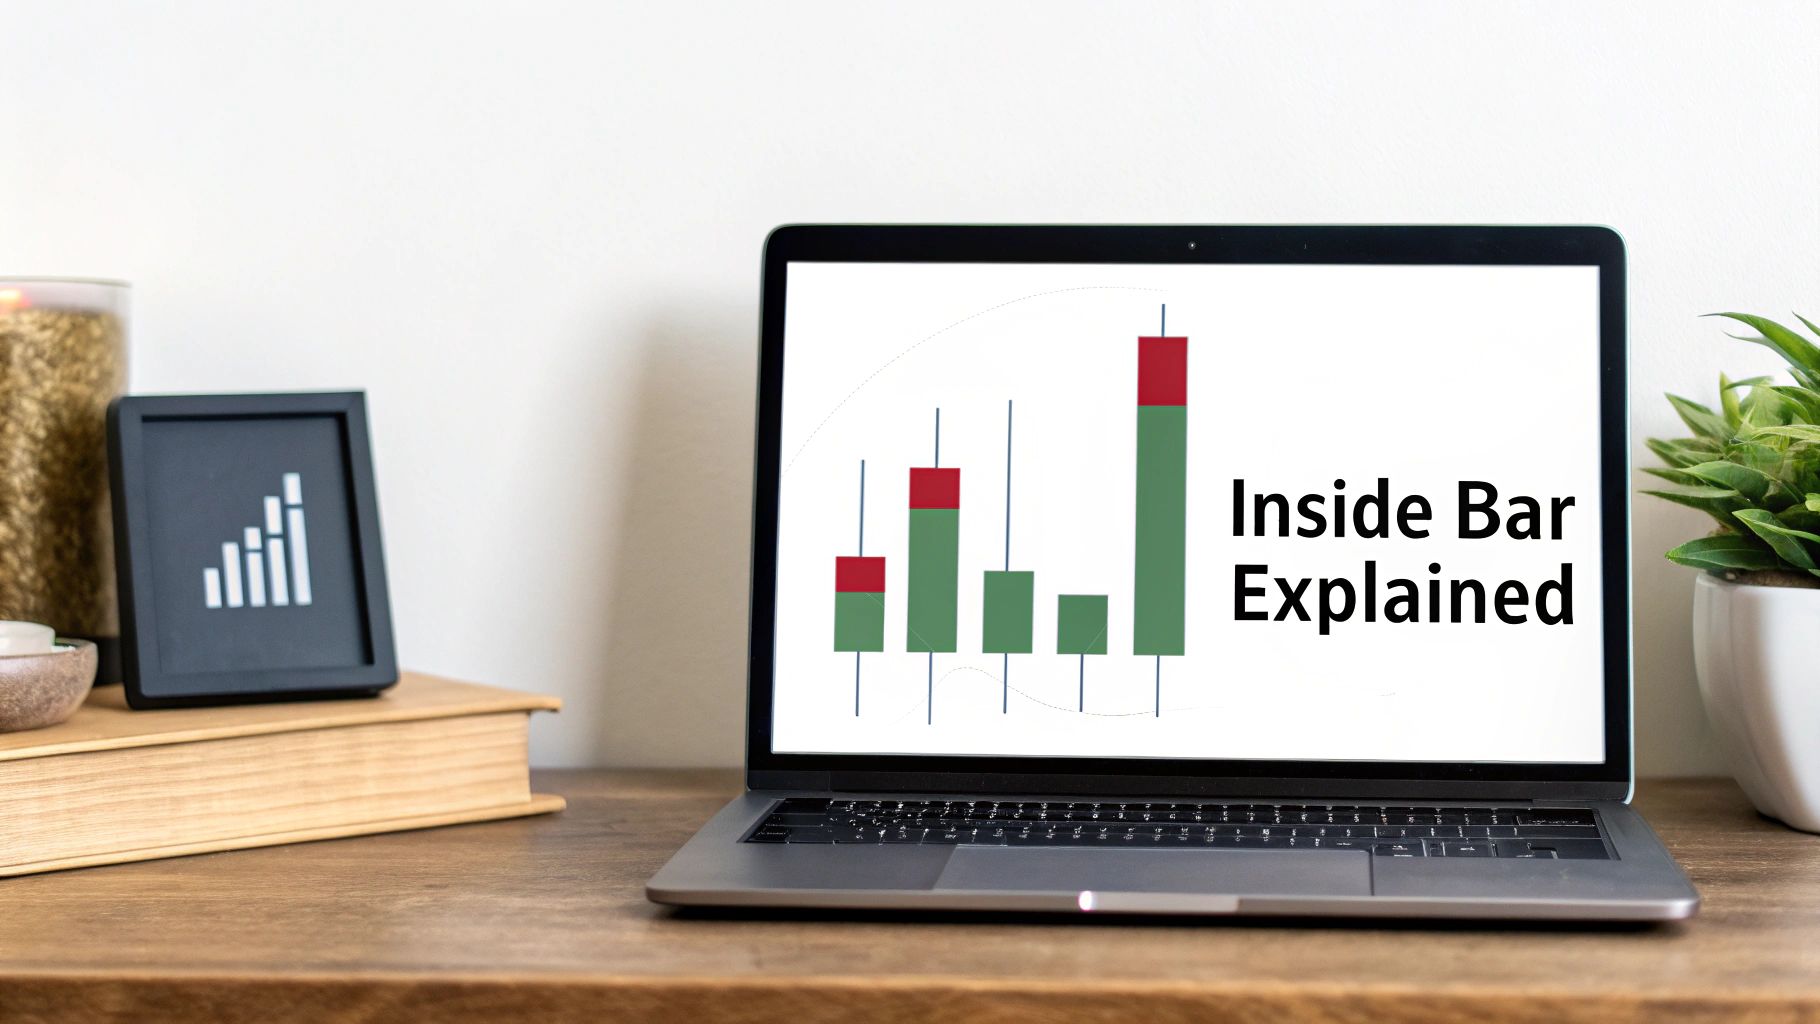
When an inside bar forms, it tells a story about the temporary truce between buyers and sellers. It’s a visual sign that volatility is shrinking and the market has found a temporary balance after a strong push in one direction.
The pattern itself is made up of two candles:
The Mother Bar: This is the first, larger candle that sets the high and low for the pattern. It's the "container" for the price action.
The Inside Bar: This is the second, smaller candle. Its high is lower than the mother bar's high, and its low is higher than the mother bar's low. It's completely engulfed by the range of the preceding candle.
Think of it as a coiled spring. The mother bar is the big expansion, and the inside bar is the compression, where energy builds. Neither bulls nor bears can break out of the previous candle's range, creating a tight standoff that often leads to a powerful release.
Why This Pattern Matters To Traders
Spotting an inside bar on your chart is significant. It’s a clear sign that a potential trade opportunity is developing, and it provides a specific price range to watch. If the price breaks above the high of the mother bar, it may signal that bulls are regaining control. A break below the low suggests bears might be taking over.
The inside bar pattern is a classic sign of market consolidation. It shows a temporary pause in a trend, offering a low-risk entry point for traders anticipating the next directional move. Recognizing this structure is a key skill in price action analysis.
This pattern isn't a random formation; it’s a direct reflection of market indecision. By learning how to read it, you can prepare to enter a trade right as the market reveals its next intended direction. It's an invaluable tool among the many other chart patterns in forex traders use to make informed decisions.
The real strength of the inside bar is its simplicity and universal application. You'll find it in forex, stocks, and crypto, and on every timeframe from the 1-minute to the monthly chart. Mastering it is a fundamental step toward proficiency in price action. As always, remember that all trading involves substantial risk of loss, and this content is for educational purposes only, not financial advice.
How To Find The Best Inside Bar Setups
Just spotting an inside bar is only the first step; risking capital requires more diligence. The real skill is learning to filter out mediocre setups and focus only on high-probability opportunities. It's less about seeing a two-candle pattern and more about understanding the context of the market story.
A high-probability inside bar is the right pattern, in the right place, at the right time. It’s not just a signal in a vacuum; it’s a clue that confirms other evidence on your chart.
The Basic Anatomy of a Valid Inside Bar
Before considering market context, the pattern must be technically correct. This structure is the foundation of the entire trade idea.
Here's a quick, two-part check to ensure you have a valid pattern:
Spot the Mother Bar: First, you need a strong, relatively large candle. This is your "mother bar," and it sets the boundaries for the setup. A small, weak-looking mother bar usually leads to an unreliable signal.
Confirm the Inside Bar: The very next candle must be completely "engulfed" by the mother bar. This means its high is lower than the mother bar's high, and its low is higher than the mother bar's low.
If both conditions are met, you have a valid pattern. If the second candle touches the high or low of the mother bar, it's not a true inside bar, and the setup is invalid.
Common Variations You'll See in the Wild
While the classic setup involves a single inside bar, you'll often encounter a few variations. Learning to read these can provide a deeper understanding of market dynamics.
Multiple Inside Bars: Sometimes you'll see two, three, or even more candles form inside the mother bar's range. This "coiling" pattern signals that pressure is building intensely. The more candles trapped in the range, the more explosive the eventual breakout is likely to be.
Small Mother Bar: An inside bar that forms after a tiny, low-volatility mother bar is often a trap. These tend to appear in choppy, sideways markets and lack the compressed energy needed for clean follow-through. The best setups are born from a strong, directional move captured by a large mother bar.
The most powerful inside bar setups are born from volatility. They represent a brief, quiet pause after a loud, decisive market move. Ignoring the context of the mother bar is one of the most common mistakes traders make.
Using a Quick Identification Checklist
To make this process systematic, use a mental checklist every time you believe you've found a setup. This discipline prevents you from acting on every mediocre pattern.
This table helps you quickly validate a setup before considering a trade.
Inside Bar Pattern Identification Checklist
| Checklist Item | Criteria for a Valid Pattern | Common Mistake to Avoid |
|---|---|---|
| Mother Bar | Is it a large, clear candle that stands out from the recent price action? | Trading patterns with small, indecisive mother bars that show no real commitment from buyers or sellers. |
| Inside Bar(s) | Are the high and low fully contained within the mother bar's range? | Misidentifying a candle that just touches or slightly breaks the mother bar's high or low. Precision is everything here. |
| Market Context | Does the pattern appear after a strong trend or right at a key support/resistance level? | Trying to force a trade in the middle of a choppy, range-bound market that has no clear direction. |
| Timeframe | Are you looking at a higher timeframe, like the 4-hour or daily chart? | Getting sucked into the noise of patterns on very low timeframes (e.g., 1-minute or 5-minute charts). |
By running through these checks every time, you train your eyes to see the full picture, not just the pattern. This separates traders who react to every minor price flicker from those who patiently wait for A+ setups. Your primary job is to protect your capital, and that often means knowing which trades not to take.
All trading involves substantial risk of loss and is not suitable for every investor. The content of this guide is for educational purposes only.
Core Trading Strategies Using The Inside Bar
Once you can spot high-probability inside bars, the next step is building a trading plan. The pattern is just a signal; your strategy is the rulebook that dictates how to act—where to enter, where to place a stop-loss, and where to take profits.
An inside bar represents a temporary drop in volatility. The following strategies are designed to capitalize on the powerful move that often occurs when that coiled energy is released. We’ll break down three distinct methods, each suited for specific market conditions.
Strategy 1: The Breakout Continuation
This is the most common and straightforward way to trade an inside bar. You are treating the pattern as a signal that a trend is likely to continue. The core idea is that the inside bar represents a brief "pause" in a strong trend, which is likely to resume its original direction.
This approach works best in strong, trending markets with clear momentum. Attempting to trade breakouts in a choppy, sideways market often leads to false signals and frustration.
Here’s the step-by-step framework for trading an inside bar breakout:
Identify a Clear Trend: Confirm the market is in an uptrend (higher highs and higher lows) or a downtrend (lower lows and lower highs). A 20 or 50-period moving average can help visually confirm the trend's direction.
Wait for an Inside Bar: Once a trend is established, wait for a valid inside bar pattern to form. The best setups often appear after a strong push in the direction of the trend.
Set Your Entry Order: Place a buy stop order a few pips above the high of the mother bar for an uptrend. In a downtrend, place a sell stop a few pips below the mother bar's low. This ensures you only enter once the price confirms momentum in your intended direction.
Place Your Stop-Loss: Your stop-loss goes on the opposite side of the mother bar. For a long trade, it sits a few pips below the mother bar's low. For a short trade, it goes a few pips above the mother bar's high. This clearly defines your risk before entry.
Determine Profit Targets: Aim for a risk-to-reward ratio of at least 1:2. If your stop-loss is 50 pips from your entry, your first target should be at least 100 pips away. You can also use key support or resistance levels as logical profit targets.
In trending forex markets, the inside bar shines as a continuation signal. A clear example occurred in early 2022 on the EUR/USD daily chart. After a steep downtrend, a textbook inside bar formed on March 8. The subsequent breakout below the mother bar's low led to a 450-pip drop in just two weeks—a 4.17% decline. As noted in this detailed inside bar trading strategy guide, such setups in strong trends can have success rates in the 65-75% range, especially when aligned with higher timeframe momentum.
This flowchart breaks down the visual process for confirming a valid inside bar pattern.
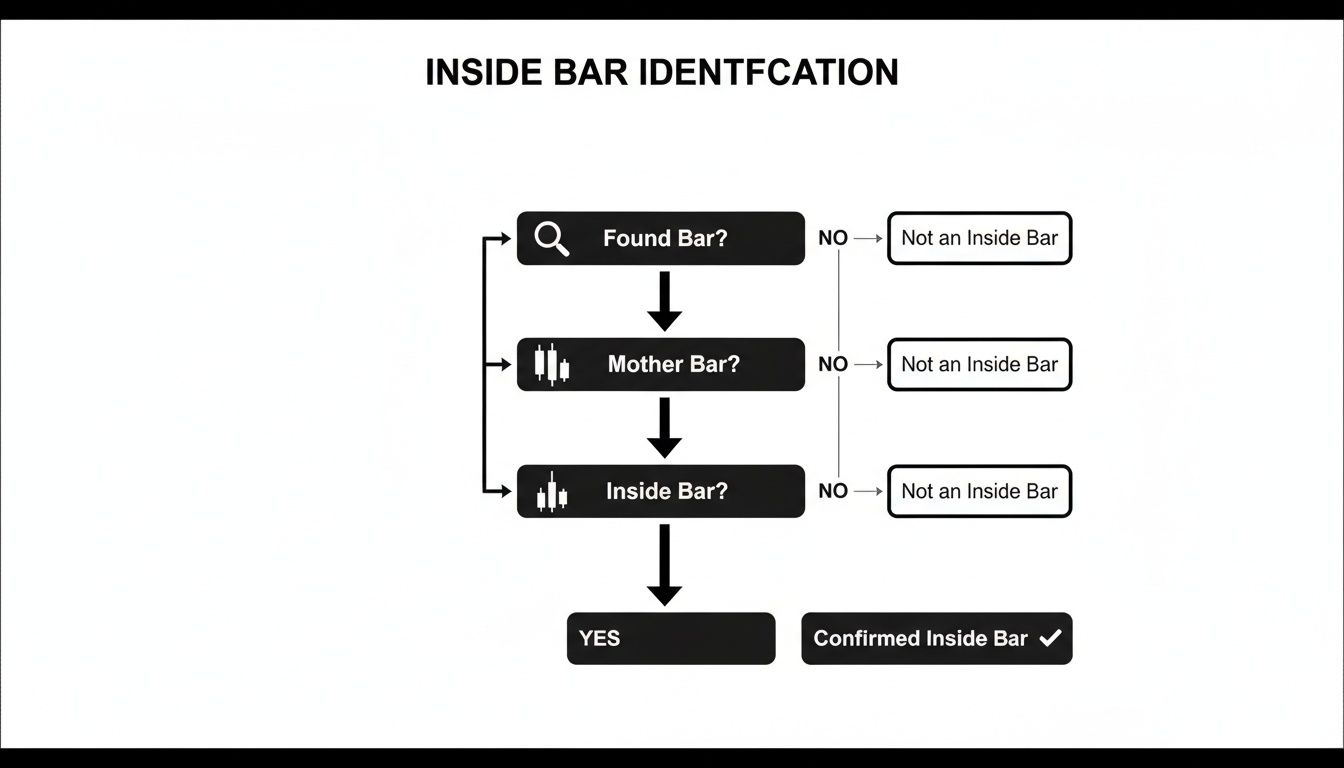
This decision tree helps you quickly filter signals, ensuring you only act on patterns meeting the strict criteria of a mother bar followed by a fully contained inside bar.
Strategy 2: The Reversal at Key Levels
While breakouts are continuation plays, an inside bar can also signal a major reversal. However, this is only effective when the pattern appears at a significant market turning point. These setups require more patience and an understanding of market structure but can offer excellent risk-to-reward potential.
The location of an inside bar is often more important than the pattern itself. An inside bar in the middle of nowhere is noise. An inside bar at a major daily support level after a long decline is a powerful signal.
The key concept here is confluence—when multiple technical signals align. The inside bar is your entry trigger, but the reason for the trade is the major support or resistance level holding firm.
Here’s how to trade it:
Identify Key Levels: Mark the major horizontal support and resistance zones on a higher timeframe chart (like the daily or weekly). These are the areas where major market moves often originate.
Watch for Price to Test the Level: Observe price action as it approaches one of these key levels. Look for signs that momentum is stalling or the level is being rejected.
Wait for the Inside Bar Signal: A bullish inside bar at a major support level is a strong indication that selling pressure is exhausted. Conversely, a bearish inside bar at major resistance suggests buyers are losing momentum.
Execute the Trade: The entry and stop-loss rules are nearly identical to the breakout strategy. For a bullish reversal off support, enter on a break of the mother bar’s high, with your stop placed below its low. For a bearish reversal from resistance, enter on a break of the mother bar’s low, with a stop just above its high.
Strategy 3: The 'Fakey' or False Breakout
The "Fakey" is an advanced setup that capitalizes on a failed inside bar breakout. It's a favorite among many price action traders because it traps those who jumped on the initial breakout. When these traders are forced to exit their positions, it adds fuel to the move in the opposite direction.
The pattern has three parts:
A standard inside bar pattern forms.
Price makes a brief initial move outside the mother bar's range (e.g., breaking just above the high).
The move fails, and the price quickly reverses to close back inside the mother bar's range, creating a false breakout, or "fakeout."
For a bullish Fakey (a failed downside breakout), you would place a buy stop just above the mother bar's high. For a bearish Fakey (a failed upside breakout), the entry is a sell stop just below the mother bar's low. The stop-loss is placed just beyond the wick of the false breakout. With this strategy, you are trading against the crowd that was just caught on the wrong side of the market.
Using Advanced Filters To Improve Your Win Rate
Spotting an inside bar is easy. The real skill is being selective enough to pass on ten "okay" setups to catch the one "A+" opportunity. This is where filters become essential.
Think of an inside bar as your first clue. To build a strong case for a trade, you need more evidence. In trading, your filters are that supporting evidence.
Adding The Power Of Confluence
Confluence is when multiple, independent signals all point to the same outcome. An inside bar floating in the middle of a chart is not a strong signal. But an inside bar forming at a major support level, bouncing off a moving average, with increasing buying volume? That's a high-conviction trade.
Here are a few powerful filters you can start using immediately:
Higher Timeframe Trend: This is non-negotiable. Before trading an inside bar on the 1-hour chart, zoom out to the 4-hour or daily chart. Is the market moving in the same direction? Trading with the larger trend is one of the single biggest ways to improve your odds.
Key Support and Resistance: An inside bar at a well-defined support or resistance zone is far more powerful than one in the middle of a range. These are the levels where institutions often make their stand.
Moving Averages: A simple 20 or 50-period moving average can act as dynamic support or resistance. A textbook continuation trade is a bullish inside bar that forms after price pulls back to and respects the 50 MA in an established uptrend.
Incorporating Volume And Momentum
Price action shows you what happened, but indicators can offer insight into how it happened, revealing the conviction behind a move.
Volume directly measures market participation. A breakout from an inside bar on weak volume is a major red flag. Conversely, a breakout accompanied by a large volume spike shows that big players are involved, increasing the odds of follow-through.
Momentum oscillators like the Relative Strength Index (RSI) also add valuable context. For instance, if you see a bullish inside bar at key support and the RSI shows bullish divergence (price made a new low, but the RSI made a higher low), it's a powerful sign that selling pressure is fading.
Tools that blend price and volume, like the Volume-Weighted Average Price, are also very useful. For a deeper dive, check out our guide on what is VWAP and see how it helps pinpoint areas of liquidity.
The goal of using filters is not to find more trades, but to find better trades. It's a shift from being a pattern-spotter to a strategic market analyst who patiently waits for all the puzzle pieces to align.
This kind of patience is what separates professionals from the crowd. It’s the discipline to say "no" to dozens of mediocre setups while waiting for the one where all your conditions are met.
Inside bars can be potent signals at major market turning points. Backtested data on the GBPUSD daily chart from 2015-2020 shows their power. An inside bar at the 1.5200 support level in August 2015 correctly identified the bottom of a downtrend, leading to a 1,200-pip rally.
Further price action analysis shows these reversal setups, particularly when combined with pin bars, can have a success rate of 55-65% and often deliver a risk-reward ratio of 1:3 or better.
Building Your A+ Trade Checklist
To make this practical, create a literal checklist. Before placing a trade, you must run through your list and ensure every box is ticked. No exceptions.
A simple checklist might look like this:
Is there a clean, valid inside bar pattern?
Does the trade align with the trend on the 4-hour or daily chart?
Did the pattern form at a major, pre-identified support or resistance level?
Is there another confirming signal (e.g., a bounce off a key moving average)?
Is there sufficient volume to support a potential breakout?
This process removes emotion and forces you to be a disciplined, plan-driven trader. You stop reacting to the market and start executing your strategy with precision. Remember, all trading carries risk, and no strategy is foolproof.
Practical Risk Management For Prop Firm Traders

Disciplined risk management is the bedrock of survival in a prop firm environment. The rules are strict, and there is no room for error. One oversized loss that breaches the daily drawdown limit can result in immediate disqualification.
The inside bar pattern is well-suited for this environment. Its structure provides a clear and logical place for a stop-loss, removing guesswork from risk management.
The Prop Firm Risk Framework
Trading a funded account is a different challenge. Your primary job is not to chase huge profits but to protect the firm's capital so you can stay in the game.
The inside bar fits perfectly into this framework by providing a natural "line in the sand" for your risk.
For a long (buy) trade: Your stop-loss sits a few pips below the low of the mother bar.
For a short (sell) trade: Your stop-loss goes a few pips above the high of the mother bar.
This mechanical placement enforces discipline. If the market breaks the other side of the mother bar, your trade idea is invalidated, and you exit with a small, pre-calculated loss.
In prop firm trading, your first priority is capital preservation. The inside bar's clear structure offers a built-in risk management tool, allowing you to define your exact invalidation point before you even enter a trade.
Sizing Your Position Correctly
Once you know where your stop-loss will be, calculating your position size is simple math. This is a critical step to ensure no single trade can knock you out of an evaluation. For most prop firm challenges, risking a conservative 0.5% to 1% of your account balance per trade is the professional standard.
Let's walk through a quick example on a $100,000 account:
Define Your Risk: You decide to risk 0.5% of your capital, which is $500.
Measure Your Stop Distance: You spot a bullish inside bar on EUR/USD. The mother bar's low is at 1.0710, so you set your stop at 1.0700. With an entry at 1.0730, your stop distance is 30 pips.
Calculate Position Size: Divide your dollar risk ($500) by your stop distance in dollars to determine the precise lot size needed to maintain your risk parameter.
This methodical process is key to staying within the firm's drawdown limits. Mastering this is a huge part of the secret to long-term success in prop firm trading.
Navigating Firm-Specific Rules
Every prop firm has a unique rulebook. While the inside bar is an adaptable pattern, you must always be aware of constraints like news trading restrictions and weekend holding policies.
Before taking any inside bar trade, run through a quick mental checklist to ensure you remain compliant with common prop firm rules.
Prop Firm Risk Management Protocol for Inside Bar Trades
| Rule Category | Actionable Guideline | Reasoning |
|---|---|---|
| Position Sizing | Calculate lot size to risk no more than 0.5% – 1% of your account. | Prevents a single loss from breaching daily or max drawdown limits. |
| Daily Drawdown | Ensure your calculated stop-loss, if hit, won't exceed the daily loss limit. | This is a non-negotiable rule; violating it often means instant failure. |
| News Events | Check the economic calendar. Avoid entering if a major release is imminent. | Many firms restrict trading during high-impact news to prevent slippage and volatility. |
| Weekend Holding | Plan to close the trade before the market closes on Friday unless your account allows it. | Protects the firm (and you) from unpredictable weekend gap risk. |
| Max Lot Size | Confirm your calculated position size doesn't exceed the firm's maximum lot exposure. | Some firms cap the total lot size you can have open at any one time. |
By internalizing these checks, you combine the statistical edge of the inside bar pattern with the disciplined risk management required to pass a funding challenge.
Common Mistakes To Avoid When Trading Inside Bars
Learning any trading pattern comes with a learning curve, and the inside bar is no exception. By understanding the common pitfalls upfront, you can avoid mistakes that trip up most new traders.
It’s easy to get tunnel vision when hunting for a specific setup. Aspiring traders often get so fixated on spotting the two-candle pattern that they ignore the bigger market picture. An inside bar in a messy, sideways market is almost always just random noise, not a reliable signal.
Forcing Trades In The Wrong Market Condition
The single biggest mistake is trying to force inside bar breakouts in a choppy, range-bound market. These low-volatility environments are known for producing false breakouts that look promising for a moment before reversing and hitting your stop. The inside bar is most effective when there is clear directional momentum or when it forms at a major turning point.
Your job as a trader isn't just to find patterns; it's to find them in the right context. An inside bar in a strong trend is a potential continuation signal. An inside bar in a messy range is probably a trap.
The fix is simple: always zoom out. Before placing an order, look at the daily or 4-hour chart to get your bearings. If there is no clear trend and the market is moving sideways, it's often best to wait for a better setup.
Ignoring The Power Of Rarity
Another common error is overtrading the pattern. Just because you see an inside bar doesn't mean you have to trade it. The truly A+ setups are infrequent, and that scarcity is what makes them valuable. They signal a meaningful compression of energy.
Research supports this. One study showed the inside bar pattern might appear on only 22% of trading days. But when it did, the price broke out of the prior day's range nearly 78% of the time. More recent data on the SPY suggests the pattern is even rarer, around 12% of the time, but with breakouts succeeding a whopping 88% of the time. You can review more data on inside bar breakout success rates to see the statistical edge. This highlights the importance of being patient and selective.
Setting Stops Too Tight
Finally, many traders sabotage good trades by placing their stop-loss too close to the mother bar. They try to minimize their risk in pips but end up getting stopped out by normal market fluctuations. You must give the trade some room to breathe.
Always set your stop-loss a few pips beyond the high or low of the mother bar. This buffer helps ensure you are only taken out of the trade if the setup is truly invalidated, not just by temporary price noise.
Frequently Asked Questions
Let's address some common questions about trading the inside bar pattern. Clarifying these practical details will help you trade the pattern with more confidence.
How reliable is the inside bar pattern?
No single pattern is 100% reliable. The inside bar's strength comes from its context. An inside bar forming at a major support level during a strong uptrend is a high-probability setup. In contrast, one that appears randomly in a choppy, directionless market is far less reliable. Think of it as a confirmation tool rather than a standalone signal. Its reliability increases dramatically when combined with other confirming factors.
What is the best timeframe to trade inside bars?
You can find inside bars on all timeframes, but they are most reliable on higher timeframes like the 4-hour, daily, and weekly charts. Candles on these timeframes represent more significant market activity and filter out much of the noise present on lower timeframes. A daily inside bar shows a full day of indecision, which carries more weight than a 5-minute pause.
Can I combine the inside bar pattern with other indicators?
Yes, and you should. Combining signals, or seeking confluence, is what separates high-conviction trades from coin flips. For example, a bullish inside bar that forms at a key support level that also aligns with a 50-period moving average is a much stronger signal. Good indicators to pair with the inside bar include moving averages, the Relative Strength Index (RSI) for momentum, and volume analysis to confirm breakout strength.
What is the difference between an inside bar and a harami pattern?
The inside bar and the harami are very similar two-candlestick patterns that both signal market indecision. The primary difference is in the candle bodies. In a classic Harami pattern, the body of the second candle must be completely inside the body of the first candle. For an inside bar, the entire range of the second candle (high to low) must be within the range of the first (mother) bar. The inside bar is often considered a stricter version of the harami.
Ready to apply your knowledge of the inside bar pattern in a real trading environment? Our prop firm provides the capital and structured framework for disciplined traders to prove their edge and get funded.
