
You close a profitable month on a funded account, look at the platform P&L, and assume that number is your payout. Then the true calculation emerges. Profit split, drawdown rules, payout timing, and costs all change what is deposited into your account.
That’s why a plain business calculator often fails traders. Existing calculator content usually sticks to static formulas, but prop trading adds moving parts like profit splits, drawdown caps, and scaling rules. One verified claim even notes that 70% of traders miscalculate effective splits when they ignore those variables (getharvest.com profit percentage calculator). If you want a usable profit calculator formula, you need one built for trading reality, not retail accounting alone.
Introduction
A profit calculator formula starts with basic accounting, but traders need to translate it into platform P&L, rules, and payout terms.
The universal starting point is Gross Profit = Net Revenue – Cost of Goods Sold (COGS), a standard profitability measure explained in Wall Street Prep’s gross profit overview. In plain language, gross profit tells you what’s left after direct costs. Net profit goes further and subtracts everything else. Profit margin turns that result into a percentage so you can compare one result to another.
For a trader, the confusion usually starts here. A winning trade can look like “revenue,” but your actual retained profit still depends on direct losses, commissions, platform costs, and the firm’s payout structure. If you don’t separate gross profit from net profit, you’ll overestimate what you’ve earned.
A good trading spreadsheet doesn’t just show what you made. It shows what you keep.
The Foundational Profit Formulas Every Trader Must Know
A beginner trader often opens a spreadsheet, types in a few winning trades, and assumes the account is nicely profitable. Then the numbers start to slip. A loss here, a fee there, and the final payout estimate looks much smaller than expected. The fix starts with three basic formulas.

These formulas come from standard business math, but traders need to read them through a trading lens. If you understand the foundation, building a prop firm calculator gets much easier because you can separate raw trading performance from what you keep.
Gross profit
Gross Profit = Revenue – COGS
Gross profit is the first layer. In a normal business, it shows what is left after direct production or acquisition costs. In trading terms, it works like your raw edge before you account for broader expenses, firm rules, or payout timing.
Use a simple analogy. A shop owner buys inventory for $40 and sells it for $100. Gross profit is $60. A trader does something similar. The “sale” is the closed profit from a position, and the direct cost is the cost tied to producing that result, such as losses on offsetting trades or execution-related costs you want to track.
For trading, the clean takeaway is simple. Gross profit shows whether your entries, exits, and trade management are producing positive results before the rest of the account math reduces them.
Gross profit margin
Gross Profit Margin = Gross Profit ÷ Revenue × 100
Gross profit in dollars tells you how much you made. Gross profit margin tells you how efficiently you made it.
That distinction matters. Trader A and Trader B can both produce $2,000 in gross profit, but if Trader A needed much more revenue to get there, Trader B is operating with a cleaner edge. Margin helps you compare quality, not just size.
Earlier in the article, CFI’s resource was cited to explain profit margin. Applied to trading, the point is straightforward. Strong traders usually protect more of their gross trading revenue from direct losses and execution drag, and they often pair that with solid win rates and favorable risk-reward ratios. Margin is useful because it shows whether your strategy still holds together after normal friction.
If you want a quick way to test raw trade math before building your own model, this profit and loss calculator for traders gives you a simple starting point.
Net profit margin
Net Profit Margin = Net Income ÷ Revenue × 100
Net profit margin is the stricter formula. It measures what percentage of revenue remains after all expenses are counted.
For a funded trader, the math begins to feel real. Gross profit may say your strategy worked. Net profit margin asks a harder question. After commissions, platform costs, evaluation fees, data costs, and any other account-related expenses, how much are you retaining?
That is the gap many beginners miss.
A strategy can look strong on a chart and still produce thin retained earnings once the full cost stack is added. This is also why traders outside funded accounts should pay attention to after-tax results. If you trade taxable assets on the side, managing share capital gains tax helps you understand how reported gains can differ from what you keep.
| Formula | What it measures | Why traders should care |
|---|---|---|
| Gross Profit = Revenue – COGS | Core profitability before overhead | Shows whether your trading process is producing positive raw results |
| Gross Profit Margin = Gross Profit ÷ Revenue × 100 | Efficiency of core activity | Helps compare one strategy, month, or trader against another |
| Net Profit Margin = Net Income ÷ Revenue × 100 | What remains after all expenses | Gives a clearer view of retained profitability |
A good prop firm spreadsheet starts here. First calculate what the trading produced. Then calculate how much of that performance survives costs, restrictions, and payout terms.
Adapting Your Profit Formula for Prop Firm Trading
A trader finishes the week up $8,000 on the platform and assumes payday is simple. Then the prop firm rules step in. Profit split reduces the amount, payout timing delays access, and one drawdown breach can wipe out the chance to withdraw at all.
That is why a generic business profit formula falls short here. Funded trading has a second layer of math. You are not only measuring whether the strategy made money. You are measuring how much of that money survives the firm’s rules.

The basic prop firm version
For prop trading, the first useful adjustment is simple:
Trader Payout = Gross Trading Profit × Profit Split Ratio
That formula fixes a common misunderstanding. Platform profit shows what the account made. Trader payout shows what you can claim.
If a funded account earns $8,000 and your split is 80%, your share is $6,400 before any extra costs. The platform may display the full gain, but your spreadsheet should always separate account performance from personal payout.
Some firms also layer in scaling plans, withdrawal windows, and hard risk limits. Those rules change how you judge a good month. A month with strong gains but multiple rule violations is not profitable in any practical sense.
What belongs in your spreadsheet
A prop firm calculator works like a filtered funnel. Gross P&L goes in at the top. What reaches your bank account comes out at the bottom.
To build that funnel, track these line items:
- Gross trading profit. Closed P&L from all completed trades.
- Profit split ratio. The percentage allocated to you under the funding agreement.
- Direct costs. Commissions, spreads, slippage, and any execution costs you choose to track.
- Operational costs. Evaluation fees, platform fees, data charges, or payout fees if they apply.
- Rule-based constraints. Daily loss limits and maximum drawdown limits that can disqualify future payouts.
- Payout timing. The date profit becomes eligible to withdraw, not just the date it appears on the dashboard.
Beginners often miss the last two. They record profit as soon as the chart closes green. Prop firms do not work that way. A profitable account and a withdrawable payout are related, but they are not identical.
A more realistic prop firm formula
Once you move past the basic split, the formula should reflect the actual sequence:
Estimated Net Payout = (Gross Trading Profit × Profit Split Ratio) – Direct Costs – Operational Costs
Then add a rule check beside it:
Valid Payout Status = No Daily Loss Breach + No Maximum Drawdown Breach + Payout Window Reached
This is the part generic profit articles usually skip. In a normal business, profit is mainly reduced by costs. In prop trading, profit is also shaped by permissions. You can trade well and still fail the payout test if the account breaks a rule before withdrawal eligibility.
Risk caps compress your room for error, making this metric even more important. A strategy that needs deep pullbacks or oversized recovery trades may look profitable on paper while being unusable inside a funded account.
Practical rule: Every trade in your calculator should update two outputs at once. Your payout estimate and your rule status.
Here is a simple starting model:
| Line item | Formula idea |
|---|---|
| Gross trading profit | Total closed wins minus total closed losses |
| Trader share | Gross trading profit × split ratio |
| Net payout estimate | Trader share minus applicable costs |
| Rule check | Confirm no daily loss or max drawdown breach occurred |
| Withdrawal eligibility | Confirm payout date or profit hold period has been met |
Keep the first version plain. If your spreadsheet can answer three questions clearly, it is doing its job. How much did the account make, how much belongs to you, and are you still eligible to withdraw it?
Building Your Prop Firm Profit Calculator Step by Step
You open your dashboard after a strong week and see a solid gain. Then you ask the only number that matters to a funded trader. How much of that gain can you withdraw without breaking a rule?
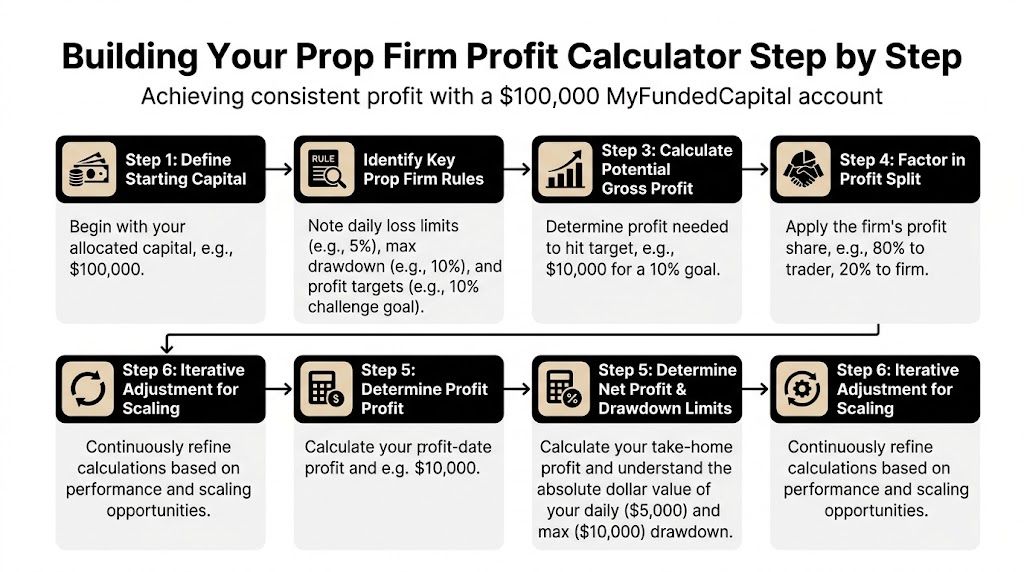
A useful prop firm calculator answers that question in plain math. It does not stop at gross profit. It tracks what the firm allows, what the split pays, what the account can tolerate, and when a payout is available. That is the difference between a generic profit sheet and one built for funded trading.
Start with account rules as fixed inputs
Begin at the top of the sheet with the rules that do not change trade by trade. These are your guardrails.
For a sample $100,000 funded account, set up cells for:
- Starting capital
- Profit split
- Daily loss rule
- Maximum drawdown rule
- Payout schedule
- Any extra costs you want to track
Keep these in separate input cells, not buried inside formulas. If the firm changes from an 80 percent split to a 90 percent split, or moves payouts from biweekly to monthly, you should be able to update one number and let the sheet recalculate everything.
Build the payout math in a simple order
Now add the working part of the calculator. A beginner mistake is trying to build the whole model at once. Build it like stairs. One step should feed the next.
Suppose the account produces $8,000 in gross profit.
Step 1
Gross Trading Profit = $8,000
If the trader receives 80%, then:
Step 2
Trader Share = $8,000 × 0.80 = $6,400
Then subtract any payout-related costs you track:
Step 3
Net Payout = Trader Share – Applicable Costs
That gives you a number you can use. This figure also matches how prop firms pay traders. A standard business calculator usually stops at profit. A prop firm calculator has to continue through split, rule compliance, and payout timing.
Add a retention layer so the sheet stays honest
Gross profit is the headline. Retained profit is the truth.
You already have the payout estimate from the prior section. Now add a second view that shows how much trading revenue you keep after the full chain of deductions. As noted earlier, net profit margin measures how much remains after costs. In a prop trading sheet, that idea helps you compare a strong-looking month against an efficient one.
Create columns for:
- Revenue
- Direct trading costs
- Gross profit
- Other costs
- Net income
- Net profit margin
This comparison is how the spreadsheet starts teaching you. Two traders can post the same gross result, but the one with lower costs and cleaner execution keeps more. The sheet makes that visible.
Connect position size to projected profit
A profit formula is only as good as the risk assumptions behind it. If your lot size is too large for the account’s daily loss rule, the projected payout is just a fantasy written in cells.
Use your trade risk first, then project the outcome. Pair the sheet with this prop firm lot size calculator before entering expected wins and losses. That gives your spreadsheet a realistic base. It is the difference between estimating from a valid trade plan and estimating from wishful thinking.
Separate projections from actual performance
Use one tab for projections and another for actual results. Mixing them together creates confusion fast.
A clean layout looks like this:
- Projection tab for planned trade frequency, target profit, expected split, and estimated costs
- Actual tab for closed trades, real payout figures, and any rule breach
- Review tab for weekly comparison between forecast and reality
The review tab matters more than traders expect. It shows whether your strategy behaves in live conditions the way it behaved in planning. If your projected payout keeps missing the actual payout, you do not need a prettier spreadsheet. You need better assumptions.
Advanced Calculations Factoring in Risk and Scaling
A basic calculator assumes profit grows in a straight line. Funded trading doesn’t work like that.

Profit is non-linear in prop trading
In a normal business formula, a rough month doesn’t usually shut the business down instantly. In funded trading, a breach can stop the account. That changes the math.
One verified framework states:
Adjusted Profit = Base Profit × (1 – Volatility Adjustment)
That model matters because a prop account can fail before your strategy has time to recover. The same verified source states that backtests on DXtrade showed unmodeled slippage and high volatility can erode profits by up to 35% (Omni Calculator margin resource).
That’s why “expected profit” should never be entered in your sheet without a risk adjustment.
What traders often assume wrong
Many traders make these assumptions:
- If the strategy is profitable long term, the funded account will survive the short term
- If the platform shows profit, payout is only a split calculation
- If the account scales, profitability scales smoothly too
Those assumptions can all break.
A funded account has hard boundaries. Daily loss limits and maximum drawdown don’t care that your system performs well over a bigger sample. If your strategy needs room to swing, the account structure can reject the strategy before the edge shows up.
Add a risk-adjusted layer to your spreadsheet
A better calculator includes three versions of profit:
| Profit view | What it means |
|---|---|
| Base profit | Raw closed-trade result before adjustments |
| Split-adjusted profit | Your share after the payout ratio |
| Risk-adjusted profit | Profit after accounting for volatility, slippage, and breach risk |
Use a notes column for market conditions that can distort outcomes. News events, thin liquidity, and weekend gaps can make the same strategy behave very differently.
If you also need to think ahead about taxable outcomes on realized gains outside the funded account context, this tool can help you estimate your CGT liability. It’s not a replacement for tax advice, but it’s a useful planning step.
And if your sheet doesn’t explicitly account for drawdown, fix that first. Understanding maximum drawdown is more important than refining your profit estimate by a few extra formula cells.
The best profit calculator formula for prop trading is never just a payout formula. It’s a payout formula plus a survival formula.
How scaling changes the calculation
Scaling sounds simple. A bigger account should mean bigger earnings. Sometimes it does. Sometimes traders just scale the same mistakes.
The right question isn’t “What happens if I trade larger?” It’s “Does my margin, execution quality, and drawdown control survive at larger size?” If your edge degrades as size increases, your projected payout curve is inflated.
That’s why your sheet should compare results across account sizes using the same performance ratios, not just the same dollar targets.
Common Miscalculations and How to Avoid Them
Most profit mistakes aren’t math mistakes. They’re assumption mistakes.
Don’t confuse platform P&L with personal payout
The account balance or closed profit number is not automatically your withdrawable amount.
Do this instead: run every result through your split formula first, then subtract any costs you personally track. Keep “platform profit” and “estimated payout” in separate columns.
Don’t ignore rule-based account failure
A strategy can look profitable in hindsight and still be unfit for a funded account because a breach would have stopped trading before the recovery period.
Do this instead: mark any day that would violate the account rules. Your spreadsheet should flag survival, not just profitability.
Don’t treat payout timing as a minor detail
Cash flow affects decision-making. A profitable trader can still make poor planning decisions if they assume money is available before it’s payable.
Do this instead: add a payout status column such as pending, eligible, requested, and received. That makes your forecasting more realistic.
Don’t use one formula for every account type
Different funding structures can change how you think about profit, risk, and access to payouts.
Do this instead: duplicate your spreadsheet template and customize the assumptions tab for each account structure you use. One clean file per structure is better than one cluttered file that hides mistakes.
Don’t forget taxes and off-platform costs
Your retained result may be lower than the account statement suggests.
Do this instead: add a planning section for real-world deductions and speak with a qualified tax professional if you’re unsure how trading-related income applies to your situation.
Trading involves risk of loss. A strong calculator won’t remove that risk, but it will stop you from lying to yourself about the numbers.
FAQ Your Prop Firm Profit Questions Answered
How does the profit calculator formula differ between instant funding and challenge accounts
The structure is similar, but the assumptions change. You still track gross trading profit, split ratio, costs, and rule compliance. What changes is when profits become relevant to you, how you view evaluation versus active payout potential, and how strict you need to be in separating projected results from withdrawable results.
Are prop firm payouts taxable income
That depends on your country, tax status, and how the payout is treated under local rules. This article is educational only and not financial advice. Use your spreadsheet to track gross amounts, retained amounts, and dates, then speak with a qualified tax professional for advice specific to your situation.
If I get a higher profit split, does the formula change
The structure doesn’t change. The input changes.
Your formula remains:
Trader Payout = Gross Trading Profit × Profit Split Ratio
If your split improves, your estimated payout rises, but your rule constraints and trading costs still matter. A better split helps, but it doesn’t fix poor execution or high volatility.
What’s the biggest beginner mistake when building a profit calculator
Most beginners track only winning outcomes. They don’t track breach risk, slippage, or non-trading deductions.
A better spreadsheet records three realities at once:
- what the strategy made
- what the contract allows you to keep
- what the account rules allowed you to survive
Conclusion Put Your Formula to the Test
Professional trading isn’t just about finding entries. It’s about knowing what your results mean.
A solid profit calculator formula starts with gross profit, moves through net profit, and then gets adapted for funded trading with profit splits, drawdown rules, and payout timing. Once you put those pieces into a spreadsheet, your earnings stop being a guess. They become a model you can review, challenge, and improve.
Keep it simple at first. Track actual numbers. Separate platform profit from personal payout. And don’t forget that trading involves risk of loss. This is educational content only, not financial advice.
If you want to apply this math to a real prop environment, explore the funding programs at MyFundedCapital, compare account types, and choose the setup that best fits your strategy and risk control.