Struggling to find clear trade setups when the market goes sideways? This guide will show you how to use trading triangle patterns to spot market consolidation and prepare for the powerful breakouts that often follow. You will learn how to identify ascending, descending, and symmetrical triangles and turn them into actionable trade plans.

What Are Trading Triangle Patterns?
A triangle pattern represents a pause or consolidation in the market, where price action gets squeezed between two converging trendlines. This period of indecision builds tension as neither buyers nor sellers can gain full control. The eventual breakout from the triangle signals that one side has won, often leading to a new, strong directional move.
Learning to identify these patterns gives you a framework for planning trades with clear entry points, stop-loss levels, and profit targets. However, no pattern guarantees a specific outcome, and all trading involves significant risk of loss. This content is for educational purposes and is not financial advice.
For a broader look at similar concepts, check out our guide to other essential chart patterns in forex.
The Three Types of Triangle Patterns Explained
Trading triangle patterns show a period of consolidation before a potential price move. The shape of the triangle tells a story about the ongoing battle between buyers and sellers.
For any triangle pattern to be valid, you should see at least four reversal points: two touches on the upper trendline (swing highs) and two on the lower trendline (swing lows). This confirms the price is genuinely contained within the pattern's boundaries.
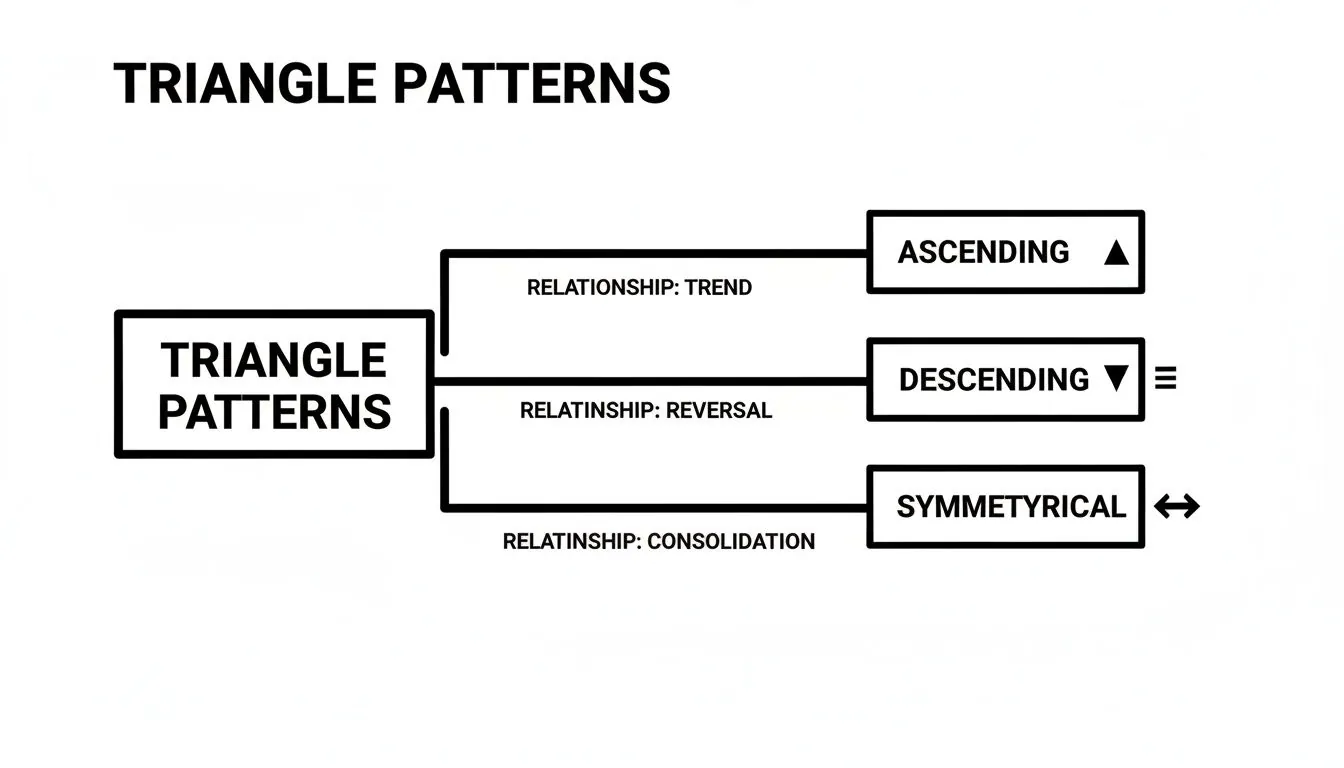
The Ascending Triangle
The ascending triangle is a bullish pattern that suggests buyers are becoming more aggressive. It forms when there is a flat resistance level (sellers holding a price) and a series of higher lows (buyers stepping in at increasingly higher prices). This action squeezes the price upward against the resistance.
- Structure: A flat upper trendline and a rising lower trendline.
- Market Sentiment: Bullish, indicating growing buying pressure.
- Typical Breakout: Upward, through the flat resistance.
- Volume: Tends to decrease as the pattern forms and then spike on the breakout.
The Descending Triangle
The descending triangle is a bearish pattern, the mirror image of the ascending triangle. It suggests sellers are gaining control. This pattern is characterized by a flat support level (buyers defending a price) and a series of lower highs (sellers pushing the price down from lower levels each time). The price is compressed downward against the support.
- Structure: A falling upper trendline and a flat lower trendline.
- Market Sentiment: Bearish, indicating growing selling pressure.
- Typical Breakout: Downward, through the flat support.
- Volume: Tends to decrease during consolidation and spike on the breakout.
The Symmetrical Triangle
The symmetrical triangle represents pure market indecision. It forms when a series of lower highs and higher lows converge toward a single point. Neither buyers nor sellers have the upper hand, and the market is waiting for a catalyst.
- Structure: A falling upper trendline and a rising lower trendline.
- Market Sentiment: Neutral or indecisive.
- Typical Breakout: Can be in either direction, though it often continues the preceding trend.
- Volume: Declines as the pattern tightens, then spikes on the breakout.
A Strategy for Trading Ascending Triangle Patterns
An ascending triangle shows buyers gaining strength. Your goal is to enter a trade once they decisively break through resistance.
Entry, Stop-Loss, and Profit Target
- Entry: The most reliable entry is to wait for a decisive candle close above the flat resistance line. Avoid entering on a wick that just pokes through, as this can be a false breakout. A surge in volume on the breakout candle adds confirmation.
- Stop-Loss: Place your stop-loss at a logical point to manage risk. Good options include placing it just below the last swing low inside the triangle or just beneath the rising support trendline. If price breaks back below these levels, the bullish setup is likely invalidated.
- Profit Target: A common method is to measure the height of the triangle at its widest point and project that distance upward from the breakout point. For example, if the triangle height is $25 and the breakout occurs at $182, the target would be $207 ($182 + $25).
While studies suggest ascending triangles have a high probability of breaking to the upside (some stats show a 72.77% success rate), it's never a guarantee. Always use a stop-loss. This systematic approach is a key part of any good price action trading strategy.
A Strategy for Trading Descending Triangle Patterns
The descending triangle signals growing seller dominance. The strategy here is to prepare for a breakdown through the support level.
Entry, Stop-Loss, and Profit Target
- Entry: Wait for a strong candle to close decisively below the flat support line. A breakout accompanied by a spike in selling volume provides stronger confirmation that sellers are in control.
- Stop-Loss: To protect your capital, place a stop-loss just above the most recent swing high inside the triangle or just above the falling resistance trendline. This ensures you exit for a manageable loss if the bearish pattern fails.
- Profit Target: Measure the height of the triangle at its widest point (from the first peak down to the support line). Subtract that distance from the breakout point to set a logical profit target.
Descending triangles are considered reliable bearish patterns, especially in a downtrend. Some studies show they break to the downside 73% of the time. You can see more examples by reading about how to trade descending triangles on Market Rebellion.
Navigating the Neutrality of Symmetrical Triangles
The symmetrical triangle represents a true stalemate between buyers and sellers. Since the breakout direction is uncertain, the strategy is to prepare for a move in either direction.
A Strategy for Trading Both Sides
- Set Bracket Orders: The most practical approach is to place orders on both sides of the pattern.
- Set a Buy Stop Order: Place an order to go long a few pips above the descending resistance line.
- Set a Sell Stop Order: Place an order to go short a few pips below the ascending support line.
- Use an OCO Order: If your platform supports it, use an "One-Cancels-the-Other" (OCO) order. When one order is triggered, the other is automatically canceled.
- Confirm with Volume: A true breakout should be accompanied by a significant increase in volume, confirming conviction behind the move. Data shows volume can increase by 150% or more on the breakout. You can explore more of these price action pattern statistics on Samurai Trading Academy.
- Risk Management: If your buy order triggers, place your stop-loss just below the lower trendline. If your sell order triggers, place your stop-loss just above the upper trendline. This protects you from false breakouts.
- Profit Target: Measure the height of the triangle at its widest point and project that distance from the breakout point.
Risk Management and Prop Firm Considerations

Identifying a pattern is not enough; disciplined risk management is what separates successful traders from the rest. Every trade must have a pre-defined risk.
Protecting Your Capital from False Breakouts
False breakouts occur when price moves briefly outside the pattern, only to reverse and stop out traders. A practical way to reduce this risk is to wait for a break-and-retest.
Instead of entering on the initial breakout, wait for the price to pull back and test the broken trendline as new support (in a bullish breakout) or resistance (in a bearish breakout). While you may miss some explosive moves, this confirmation can improve your win rate.
Meeting Prop Firm Rules
This disciplined approach is critical for prop firm traders. At firms like MyFundedCapital, traders must adhere to strict rules, such as a 5% daily and 10% maximum drawdown. Triangle patterns provide clear, logical locations for stop-losses, making it easier to calculate your position size and stay within these limits.
Mastering risk is the foundation of successful trading. To strengthen your approach, review our guide on forex risk management strategies.
FAQ: Trading Triangle Patterns
Here are answers to some common questions traders have about using triangle patterns.
How many touches are needed to confirm a triangle pattern?
A valid triangle pattern should have at least four reversal points: two touches on the upper trendline (swing highs) and two touches on the lower trendline (swing lows). Fewer than four touches may just be random price movement, not a reliable consolidation pattern.
Are triangles always continuation patterns?
No. While they often act as continuation patterns (breaking in the direction of the prior trend), this is not guaranteed. Ascending and descending triangles have a directional bias, but symmetrical triangles are neutral. Always wait for a confirmed breakout before entering a trade—never assume the direction.
What is the best way to handle a false breakout?
The best defense is a good offense. Wait for a candle to close decisively outside the pattern, rather than entering on an initial price poke. If you do get caught in a false breakout, your pre-set stop-loss will get you out of the trade with a small, managed loss. Do not move your stop-loss; accept the loss and look for the next opportunity.
How do I measure the profit target for a triangle?
The standard method is to measure the vertical distance at the widest part of the triangle (from the first high to the first low). Then, project that same distance from the breakout point to establish a minimum price target. For example, if the triangle's height is 50 pips, your target would be 50 pips above a bullish breakout or 50 pips below a bearish breakout.
Your Next Step: Put Your Skills to the Test
Understanding how to trade triangle patterns is a valuable skill, but real learning comes from application. Proving you can execute a strategy with discipline is what defines a successful trader and is exactly what prop firms look for.
At MyFundedCapital, we provide the capital for skilled traders to prove their edge. If you are confident in your ability to manage risk and trade patterns like triangles, our funding programs offer a clear path forward. Explore our Instant Funding, 1-Step, and 2-Step Challenge accounts to find the model that best fits your trading style.
Ready to trade with our capital? Find the right funding program for you at MyFundedCapital and start your journey today.