

 AR
AR
 NL
NL
 FR
FR
 DE
DE
 ES
ES
 IT
IT
 PL
PL
 SV
SV
 PT
PT


Finding reliable entry points during a market pullback can feel like guesswork, but the Fibonacci retracement tool can bring clarity. This guide will show you exactly how to draw and interpret Fibonacci levels to identify high-probability support and resistance zones. You will learn the practical steps to apply this tool, turning theory into an actionable part of your trading strategy.
Understanding the Fibonacci Retracement Tool
The Fibonacci retracement tool helps traders measure the potential depth of a market pullback within a trend. After a strong move, the price rarely continues in a straight line; it often "retraces" or pulls back before potentially resuming its original direction. The tool automatically plots key percentage levels based on the Fibonacci sequence to highlight where this pullback might stop and reverse.
The key levels are 23.6%, 38.2%, 50%, 61.8%, and 78.6%. These levels act as potential support in an uptrend or resistance in a downtrend.
What the Levels Mean for Your Trading
These percentages are not random; they represent how much of a prior move the market has given back. They provide structure and objective reference points for your analysis. If you're new to technical tools, our guide on the basics of forex technical analysis is a great place to start.
Here's how traders use these levels for practical decisions:
- Pinpoint Potential Entries: Look for logical spots to join a trend when the price pulls back to a key level.
- Set Smarter Stop-Losses: Place stops just beyond a significant Fib level to give your trade room to work without taking on excessive risk.
- Gauge Trend Strength: A shallow retracement to the 38.2% level often signals a very strong trend. A deeper pullback to the 61.8% level is more common and often presents a solid entry opportunity.
The purpose of the tool is to help you prepare, not predict. It highlights zones where the balance between buyers and sellers is likely to shift, giving you a statistical edge.
Key Fibonacci Retracement Levels and Their Meaning
This table breaks down the most important Fibonacci levels and what they typically suggest.
| Fibonacci Level | Type of Retracement | What It Suggests | Best Use Case |
|---|---|---|---|
| 23.6% | Shallow | The trend is extremely strong and might not pull back much. | Often too shallow for a reliable entry; more of an observation level. |
| 38.2% | Shallow-to-Moderate | Indicates a healthy, strong, and fast-moving trend. | Good for aggressive entries in a momentum-driven market. |
| 50.0% | Moderate | A standard pullback level; not a true Fibonacci ratio, but widely watched. | A balanced entry point, often confirming a sustainable trend. |
| 61.8% | Deep (The "Golden Ratio") | The most-watched level for reversals; a deep but often valid pullback. | Considered a high-probability entry zone for trend continuation. |
| 78.6% | Very Deep | A last-ditch area of support/resistance before the trend is at risk. | Used for more conservative entries or to spot potential trend failure. |
Trading involves significant risk of loss. The content provided is for educational purposes only and should not be considered financial advice.
How to Identify the Right Swing High and Swing Low
Your entire Fibonacci analysis depends on selecting the correct swing points. Drawing levels on minor, insignificant price wiggles will lead to unreliable signals and failed trades. The key is to identify the market's true structural turning points.
A swing high is a price peak with lower highs on both sides. A swing low is a price valley with higher lows on both sides. The best swing points are obvious and don't require you to squint or guess.
A Practical Method for Finding Swings
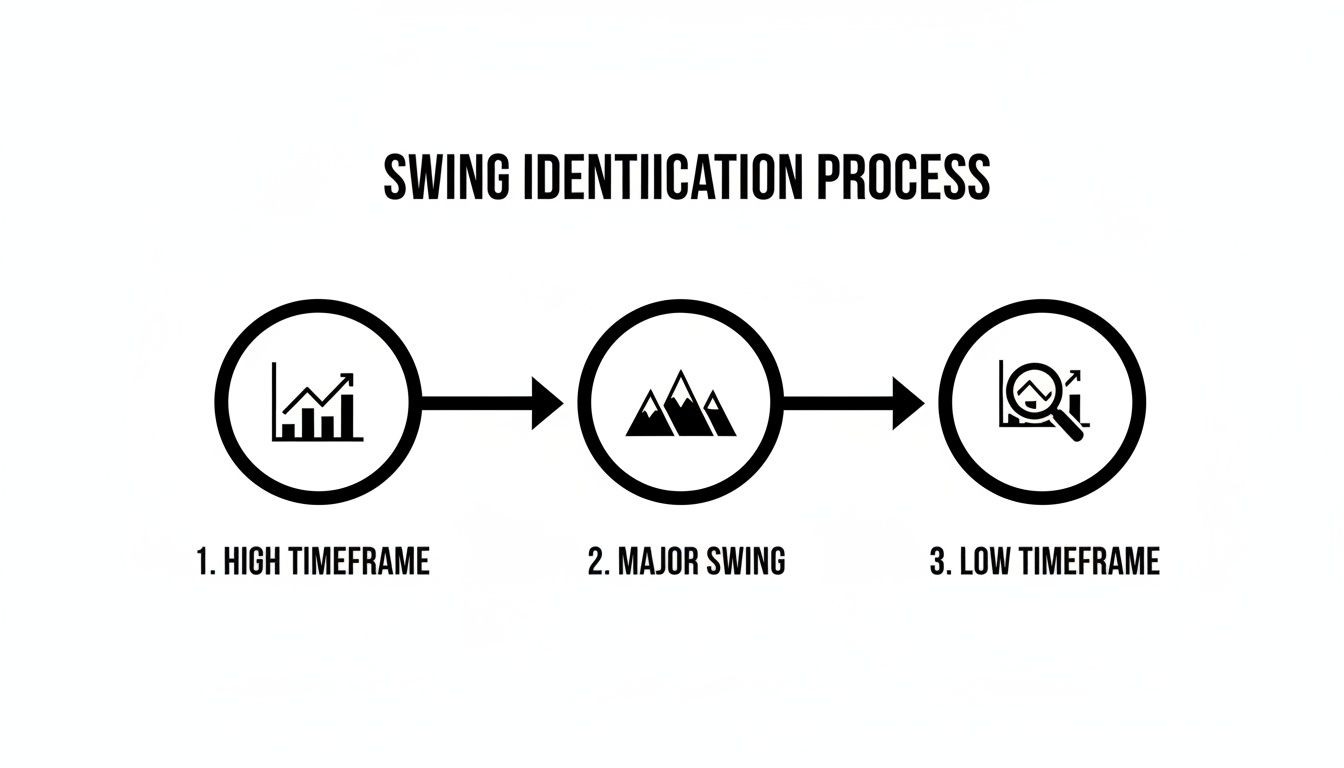
Using a multi-timeframe approach helps you focus on significant market movements and ignore smaller, distracting noise.
- Higher Timeframe (e.g., H4 or Daily): Start here to identify the primary market trend and the major swing high and swing low. This gives you the big-picture context.
- Lower Timeframe (e.g., M15 or H1): Once you've anchored your Fibonacci tool to the major swing on the higher timeframe, zoom into a lower timeframe to look for precise entry signals, like candlestick patterns, as the price approaches a key Fib level.
For example, on the EUR/USD H4 chart, you spot a strong move up from 1.0700 to 1.0900. This defines your swing. You draw the tool from the 1.0700 swing low to the 1.0900 swing high. Then, you can switch to the M15 chart and wait for a bullish entry signal if the price retraces to the 61.8% level around 1.0776.
Why Context Is Everything
The modern Fibonacci tool is a staple on platforms like MetaTrader, DXtrade, and cTrader. However, the principle is rooted in classic market analysis, tying into concepts like understanding chart patterns in forex.
A highly effective technique is to look for swing points that cause a "break of structure." A swing low is much more significant if the subsequent move breaks above a previous high. This confirms the swing was strong enough to shift market momentum. For instance, if Gold (XAU/USD) rallies from $2,300 to $2,380, breaking a prior resistance level at $2,350, that $2,300 swing low becomes a very strong anchor point for your Fibonacci tool.
A Step-by-Step Guide to Drawing Fibonacci Levels
Now let's walk through the exact steps to draw the Fibonacci retracement tool on your trading platform. The process is nearly identical across all major platforms.
First, locate the Fibonacci tool in your platform's drawing toolbar. The icon typically looks like a series of horizontal lines with a diagonal line through them.
How to Draw for an Uptrend
In an uptrend, you measure from the bottom to the top to identify potential support levels for a pullback.
- Select the tool: Click the Fibonacci Retracement icon.
- Identify the swing low: Find the starting point of the upward move.
- Click and hold: Click your mouse on the lowest point of the swing (the candle wick).
- Drag to the swing high: Drag your cursor up to the highest point of the move.
- Release: Release the mouse button on the highest point (the candle wick).
The platform will automatically plot the retracement levels between these two points.
How to Draw for a Downtrend
In a downtrend, you reverse the process, measuring from top to bottom to find potential resistance levels.
- Select the tool: Click the Fibonacci Retracement icon.
- Identify the swing high: Find the starting point of the downward move.
- Click and hold: Click your mouse on the highest point of the swing.
- Drag to the swing low: Drag your cursor down to the lowest point of the move.
- Release: Release the mouse button on the lowest point.
The levels will now appear, showing potential areas where the price might stall on a retracement upward.
Pro Tip: Always enable the 'magnet' feature in your platform's drawing settings. This will snap your cursor directly to the candle wicks, ensuring your levels are drawn with maximum precision every time.
Interpreting The Levels And Building A Trading Plan
Drawing the lines is the easy part; the real skill is in interpreting what the levels tell you and integrating them into a complete trading plan. These levels are not magic barriers but zones where buyer and seller psychology often shifts.
From Levels to Strategy
- A shallow pullback to the 38.2% level often indicates a strong, aggressive trend.
- The 50% and 61.8% levels form a "golden zone," representing a balanced pullback and a high-probability area for the trend to resume.
- The 78.6% level is a trend's last line of defense. A bounce can still occur here, but the original momentum is questionable.
Remember that these are zones, not exact price points. This is why you must wait for confirmation before entering a trade.
Never trade a Fibonacci level in isolation. The most reliable setups occur at a "confluence"—where a Fib level aligns with another technical signal, such as a major support/resistance line, a moving average, or a clear candlestick pattern (e.g., hammer, engulfing bar).
Your Actionable Trading Checklist
A structured plan separates disciplined trading from gambling. Use a checklist to ensure you cover all your bases before placing a trade.
| Checklist Item | Action Required | Example (EUR/USD Long) |
|---|---|---|
| 1. Identify Trend | Determine the dominant trend on your trading timeframe. | The 4-hour chart shows a clear uptrend. |
| 2. Draw Fibonacci | Anchor the tool from the swing low to the swing high of the last impulse. | Drawn from the 1.0650 swing low to the 1.0850 swing high. |
| 3. Find Key Level | Identify a high-probability retracement level, preferably with confluence. | The 61.8% level at 1.0725 lines up with previous resistance, now support. |
| 4. Wait for Confirmation | Look for a specific candlestick pattern to confirm entry. | A bullish engulfing candle forms and closes above the 61.8% level. |
| 5. Define Entry | Set the exact price for your entry order. | Place a buy limit order at 1.0730. |
| 6. Set Stop Loss | Place your stop loss at a logical point that invalidates the trade idea. | Set stop loss at 1.0690, just below the 78.6% level. |
| 7. Plan Take Profit | Set at least one realistic profit target based on key resistance. | Set Take Profit 1 at the recent swing high (1.0850). |
| 8. Calculate R:R | Ensure the risk-to-reward ratio meets your trading plan's minimum. | The trade offers a 1:2.5 risk-to-reward ratio to the first target. |
Following a structured plan allows you to manage risk effectively and calculate investment returns to track your performance and improve your strategy over time.
Common Mistakes to Avoid
The Fibonacci tool is powerful, but a few common errors can render it ineffective. Avoiding these pitfalls is crucial for consistent results.
1. Using Fibonacci in a Sideways Market
This is the biggest mistake. The Fibonacci retracement tool is designed to work within a trend. If the market is chopping sideways in a range, the levels are meaningless because there is no significant move to "retrace" from. Applying Fibs here will lead to false signals and losses.
2. Forcing the Tool to Fit a Bias
Another error is trying to make the tool justify a trade you already want to take. A trader might have a hunch to go long, then search for minor swing points just to make the levels line up. A valid swing point should be obvious and clear on the chart.
3. Relying on Fibonacci in Isolation
Treating a Fib level as a standalone buy or sell signal is a recipe for failure. The highest-probability trades always occur at a confluence of multiple factors. Always wait for confirmation before entering a trade.
- Price Action Confirmation: A bullish engulfing candle at a 61.8% support level shows buyers are stepping in.
- Indicator Confluence: An oversold RSI reading as price hits a key Fibonacci zone adds weight to a potential reversal.
- Market Structure: A 50% retracement that lines up with a previous resistance level (now support) is a powerful signal.
Learning to draw the lines is easy. The real skill is knowing when to use the tool and how to confirm its signals.
FAQ: Common Questions About Drawing Fibonacci Retracement
Here are answers to some of the most common questions traders have when learning to use this tool.
What is the best timeframe to use for Fibonacci retracement?
There is no single "best" timeframe; it depends on your trading style. Swing traders may focus on Daily or H4 charts to identify major trends, while day traders might use the H1 or M15 charts. A powerful method is to identify the main trend and draw Fibonacci levels on a higher timeframe (like H4) and then drop to a lower timeframe (like M15) to look for precise entry signals at those levels.
Should I draw from the candle body or the wick?
Always draw from the wicks. The wicks represent the absolute highest and lowest prices reached during a swing. Ignoring them means you are using incomplete data, which will make your levels inaccurate. Use your platform's magnet tool to snap your lines precisely to the candle wicks.
Can Fibonacci retracement predict the future?
No. Fibonacci retracement is a tool for identifying areas of potential support and resistance based on market psychology and mathematical ratios. It does not predict the future with certainty. It provides a framework of probabilities to help you make more informed trading decisions. All trading involves risk of loss.
How do I use Fibonacci with other indicators?
Combining Fibonacci levels with other tools creates "confluence," which significantly increases the probability of a trade setup. For example, if the 61.8% retracement level aligns with a 200-day moving average and an oversold RSI reading, you have a much stronger reason to consider a trade than if the Fib level stood alone. This layering of evidence is a hallmark of professional trading.
Ready to apply your skills in a professional trading environment? MyFundedCapital provides funding to traders who can demonstrate a consistent, profitable strategy. Compare our account types and start a challenge today to prove your edge and trade with our capital.
