

 AR
AR
 NL
NL
 FR
FR
 DE
DE
 ES
ES
 IT
IT
 PL
PL
 SV
SV
 PT
PT


If you mostly trade forex or indices, adding a single stock like 0388.HK can feel unfamiliar at first. The issue isn’t finding a chart. It’s knowing how to read the 0388 hk share price in a way that fits a CFD trader’s workflow, especially when risk limits are strict.
HKEX is a useful stock to study because it combines strong long-term market relevance with short-term technical structure. If you trade it carelessly, the same volatility that creates opportunity can also wreck a funded account fast.
Introduction Trading Beyond Forex with 0388 HK
A lot of traders hit the same wall. They know how to read EUR/USD, they understand index momentum, but when they open a Hong Kong stock chart they hesitate because the rhythm is different.
0388.HK is worth learning because it’s not just another listed company. It’s Hong Kong Exchanges and Clearing Limited, the operator behind Hong Kong’s securities and derivatives markets. That makes the 0388 hk share price more than a single-stock chart. It’s also a read on trading activity, capital markets sentiment, and Hong Kong’s role as a financial hub.
For an active CFD trader, that matters in practical ways:
- You get a liquid, well-followed instrument with enough structure for chart-based setups.
- You get news sensitivity that can create momentum, but also gap risk.
- You get a stock with both income and growth characteristics, which changes how swing traders and position traders may view pullbacks.
The right approach isn’t to treat 0388 like a random equity scalp. Treat it like a professional instrument. Start with the business, move to valuation, then decide whether the chart gives you an entry that fits your risk cap.
Practical rule: If you can’t explain what the company does in one clean sentence, you’re not ready to trade the chart aggressively.
Understanding 0388 HK A Corporate Profile of HKEX
Before you place a trade, understand the machine behind the ticker.
Why HKEX matters
HKEX is the core exchange operator in Hong Kong. In simple terms, it runs the marketplace where securities and derivatives are traded. That gives it a structural role inside the financial system rather than the usual “sell a product, hope demand holds” business model many listed companies depend on.
That’s why traders often treat the 0388 hk share price differently from a cyclical manufacturer or speculative tech name. An exchange operator sits closer to market infrastructure.
How the business translates into the stock
At a practical level, an exchange operator benefits when markets stay relevant, active, and trusted. Its business is tied to listings, trading activity, and market participation. That doesn’t mean the stock is immune to downturns. It means the market often assigns it a premium because of the quality of the underlying business.
Think about it this way:
- A miner depends on commodity prices
- A retailer depends on consumer demand
- An exchange operator depends on market ecosystem strength
That distinction matters because your chart read should reflect the business type. Strong companies can still correct hard, but they usually don’t trade like weak businesses over the long run.
What junior traders often miss
Many newer traders focus only on candles and indicators. That works until a stock reacts sharply to regulatory headlines, changes in market sentiment, or shifts in capital market activity.
With HKEX, the bigger picture matters because the company acts as a gateway between regional and international capital flows. You don’t need to become a macro analyst. You do need to respect that the stock can respond to more than a neat support-and-resistance drawing.
A practical checklist before trading 0388:
- Know the business type. HKEX is market infrastructure, not a speculative concept stock.
- Expect sensitivity to financial market conditions. If broader sentiment turns defensive, exchange names can react quickly.
- Respect headline risk. Regulatory and regional market news can affect the chart faster than retail traders can process.
Don’t trade HKEX like a penny stock with a clean trend. Trade it like a flagship financial name that can trend, stall, and reprice on news.
Accessing the Live 0388 HK Share Price and Charts
Execution starts with your workspace. If your chart setup is messy, your decision-making usually is too.
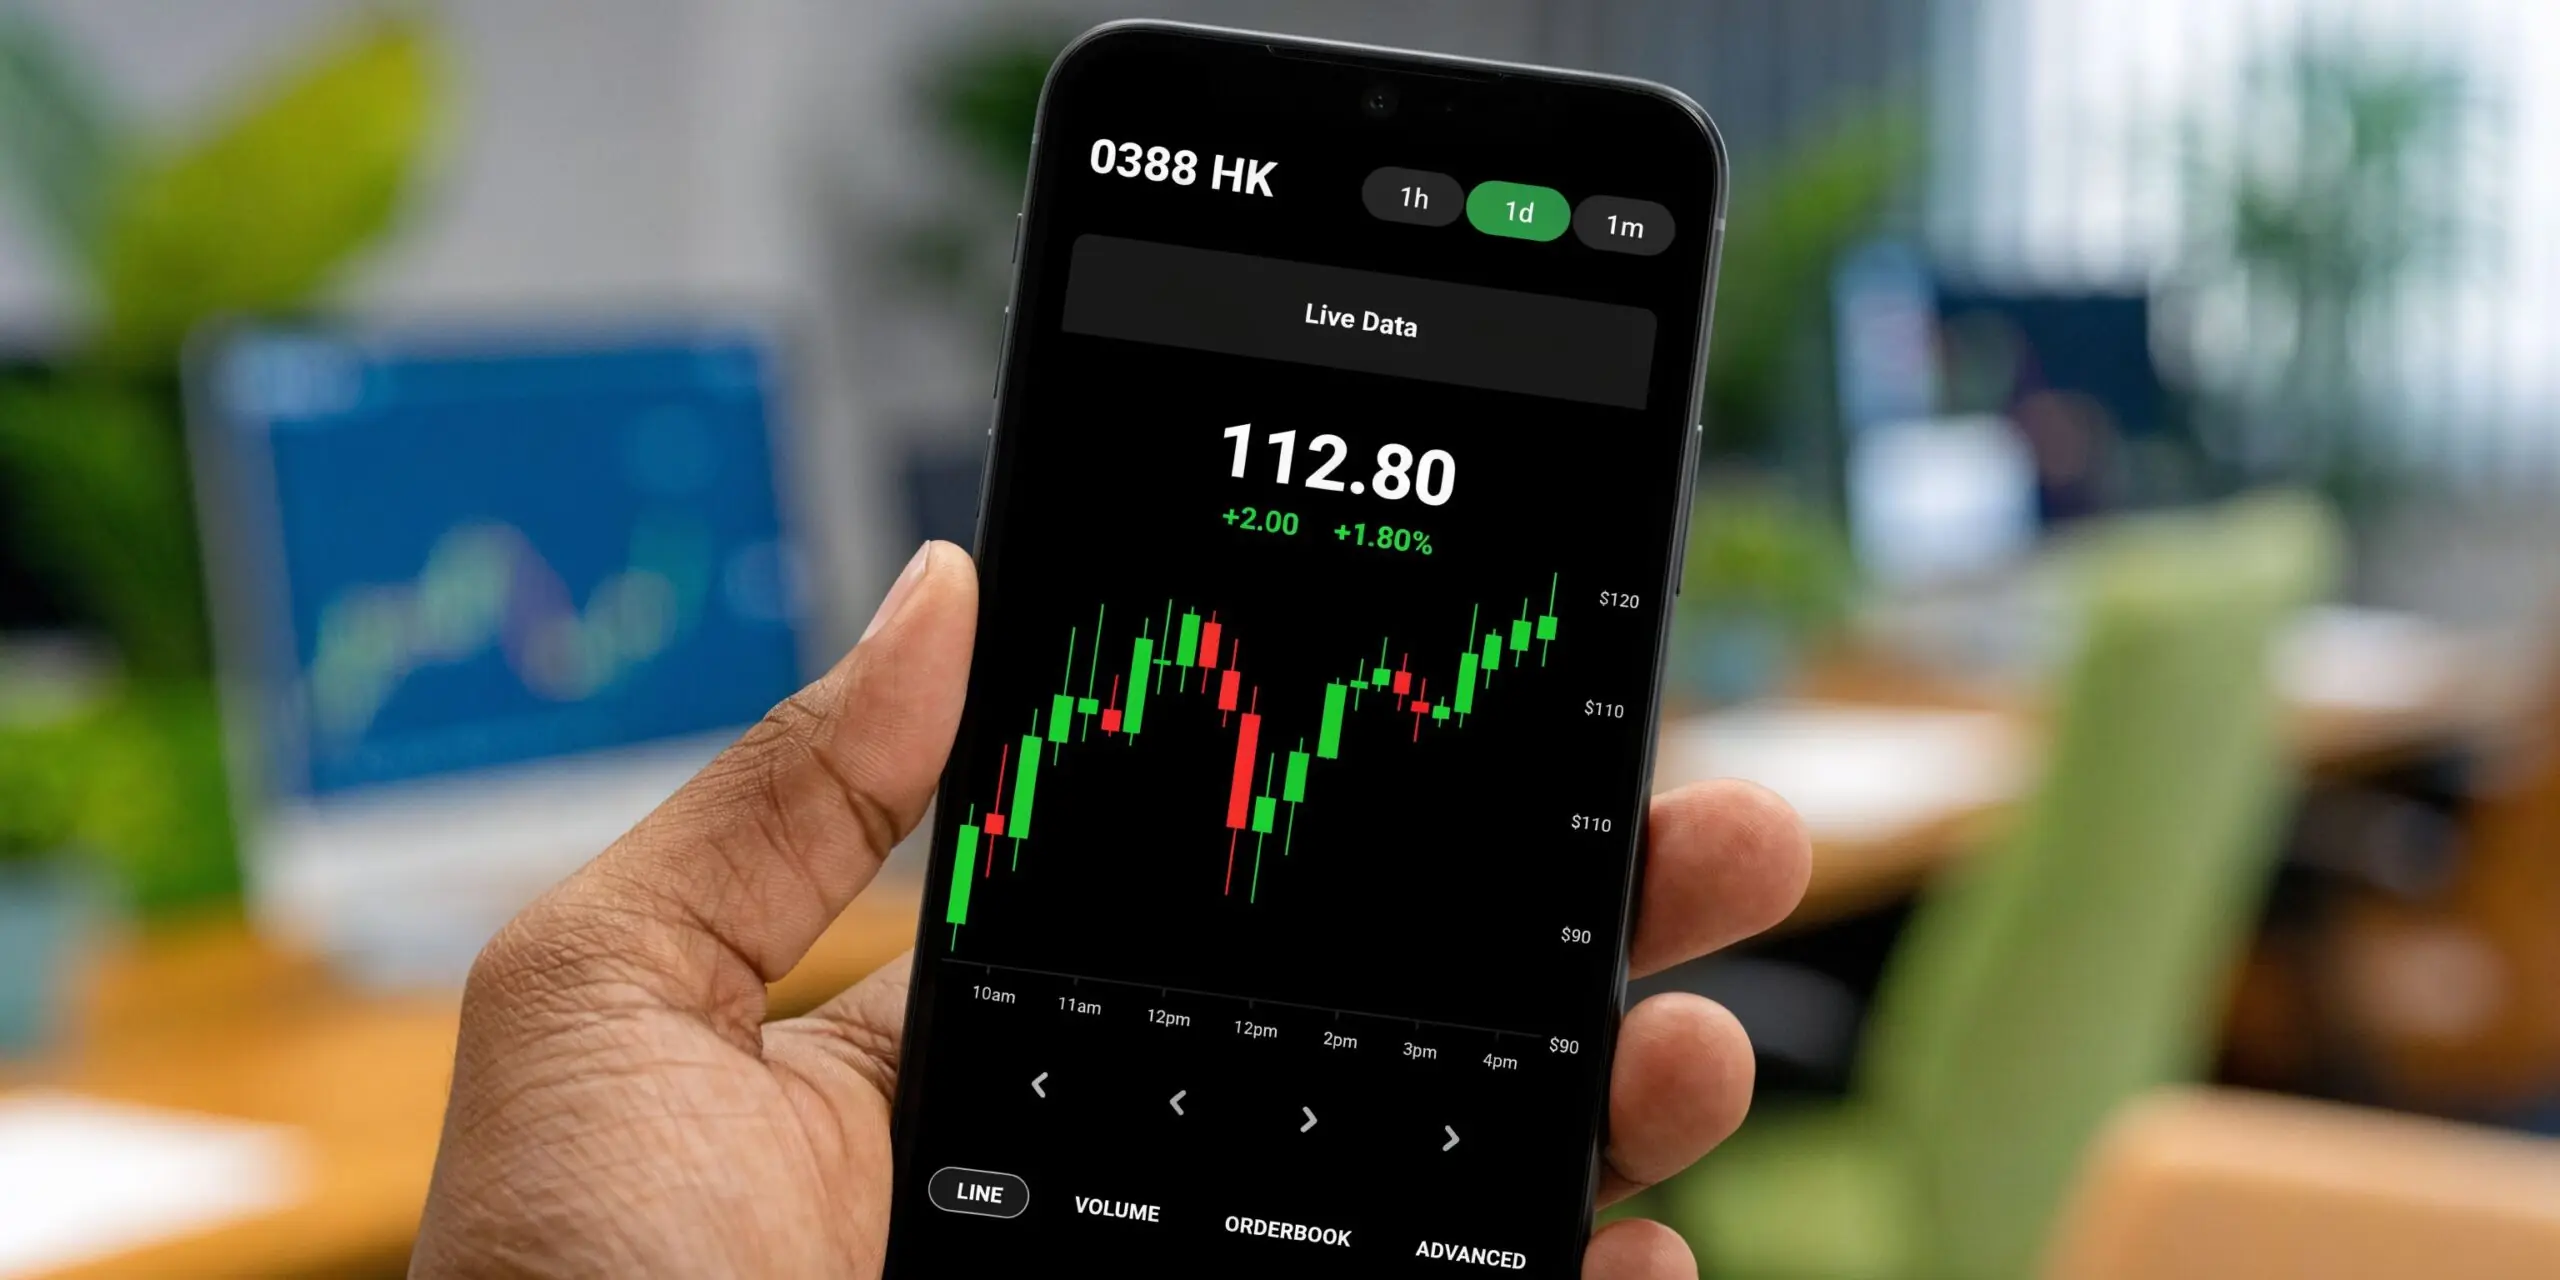
Build a chart you can actually trade from
When you pull up the 0388 hk share price on a live platform, keep the layout simple:
- One execution chart for your entry timeframe
- One higher timeframe chart to identify trend and key zones
- One watchlist panel so you’re not flipping between windows during decision time
If you want a clean practice environment before risking anything, a TradingView demo account is useful for rehearsing chart markup, alerts, and order flow habits.
What to mark first
Don’t begin with indicators. Begin with price.
Mark these before anything else:
- Recent swing highs and lows
- Obvious reaction zones
- Any clean range boundaries
- Your invalidation point before your entry point
After that, add only the indicators you use. For most traders, that means a small set such as RSI, MACD, moving averages, or VWAP-style reference tools. If you stack too much on the chart, you’ll hesitate when price reaches your level.
Use alerts to reduce bad decisions
Price alerts help more than most beginners think. They stop you from chasing candles after a move is already underway.
Set alerts around:
- Range edges
- Previous day high or low
- A breakout level you’d only trade on confirmation
- A stop-management level once you’re in
The goal isn’t to watch every tick. The goal is to stay ready when price reaches a level that matters.
Key Fundamentals An Analyst's View of 0388 HK
A trader doesn’t need to become a full equity analyst. But if you ignore valuation completely, you’ll miss why a stock can stay expensive, or why it can sell off even when the chart looked fine.
The numbers that matter
HKEX has the profile of a mature, profitable exchange operator. As of the cited market data, the stock trades at a price-to-earnings ratio of approximately 28.98 to 32.88, a price-to-sales ratio of 21.43, a trailing dividend yield of 3.12%, and average daily trading volume around 3 to 4 million shares according to Morningstar’s HKEX quote page.
That mix tells you several things at once:
- The market doesn’t treat HKEX as cheap.
- Investors are willing to pay up for its business quality.
- The dividend adds a carry angle for longer-hold participants.
- The trading volume is healthy enough to keep it relevant for active traders.
HKEX 0388.HK key financial metrics April 2026
| Metric | Value | Implication for Traders |
|---|---|---|
| P/E ratio | 28.98 to 32.88 | Premium valuation. Momentum can persist, but pullbacks can be sharp if sentiment cools. |
| P/S ratio | 21.43 | The market prices revenue aggressively, which often reflects confidence in the business model. |
| Trailing dividend yield | 3.12% | Longer-term holders may support the stock on weakness, but dividend appeal alone won’t protect short-term trades. |
| Average daily trading volume | Around 3 to 4 million shares | Useful for active participation and cleaner technical structure than thin, ignored names. |
How to think about the premium
A premium multiple isn’t automatically bearish. A lot of traders make that mistake. They see a higher P/E and assume the stock must fall.
That’s not how quality stocks behave in practice.
Sometimes the premium is justified by business quality, market position, and durability. Sometimes it stretches too far and creates mean-reversion opportunities. Your job is not to declare the stock overvalued in theory. Your job is to decide whether current price action supports continuation or whether price is getting extended relative to the setup.
If you’re building scanning or research workflows across multiple equities, tools for stock ticker enrichment can help organize company-level context before you even open the chart.
Analyst mindset: Fundamentals tell you whether a stock deserves your attention. They don’t tell you where to click buy.
Historical Price Performance and Long-Term Value
Long-term context keeps you from overreacting to short-term noise.
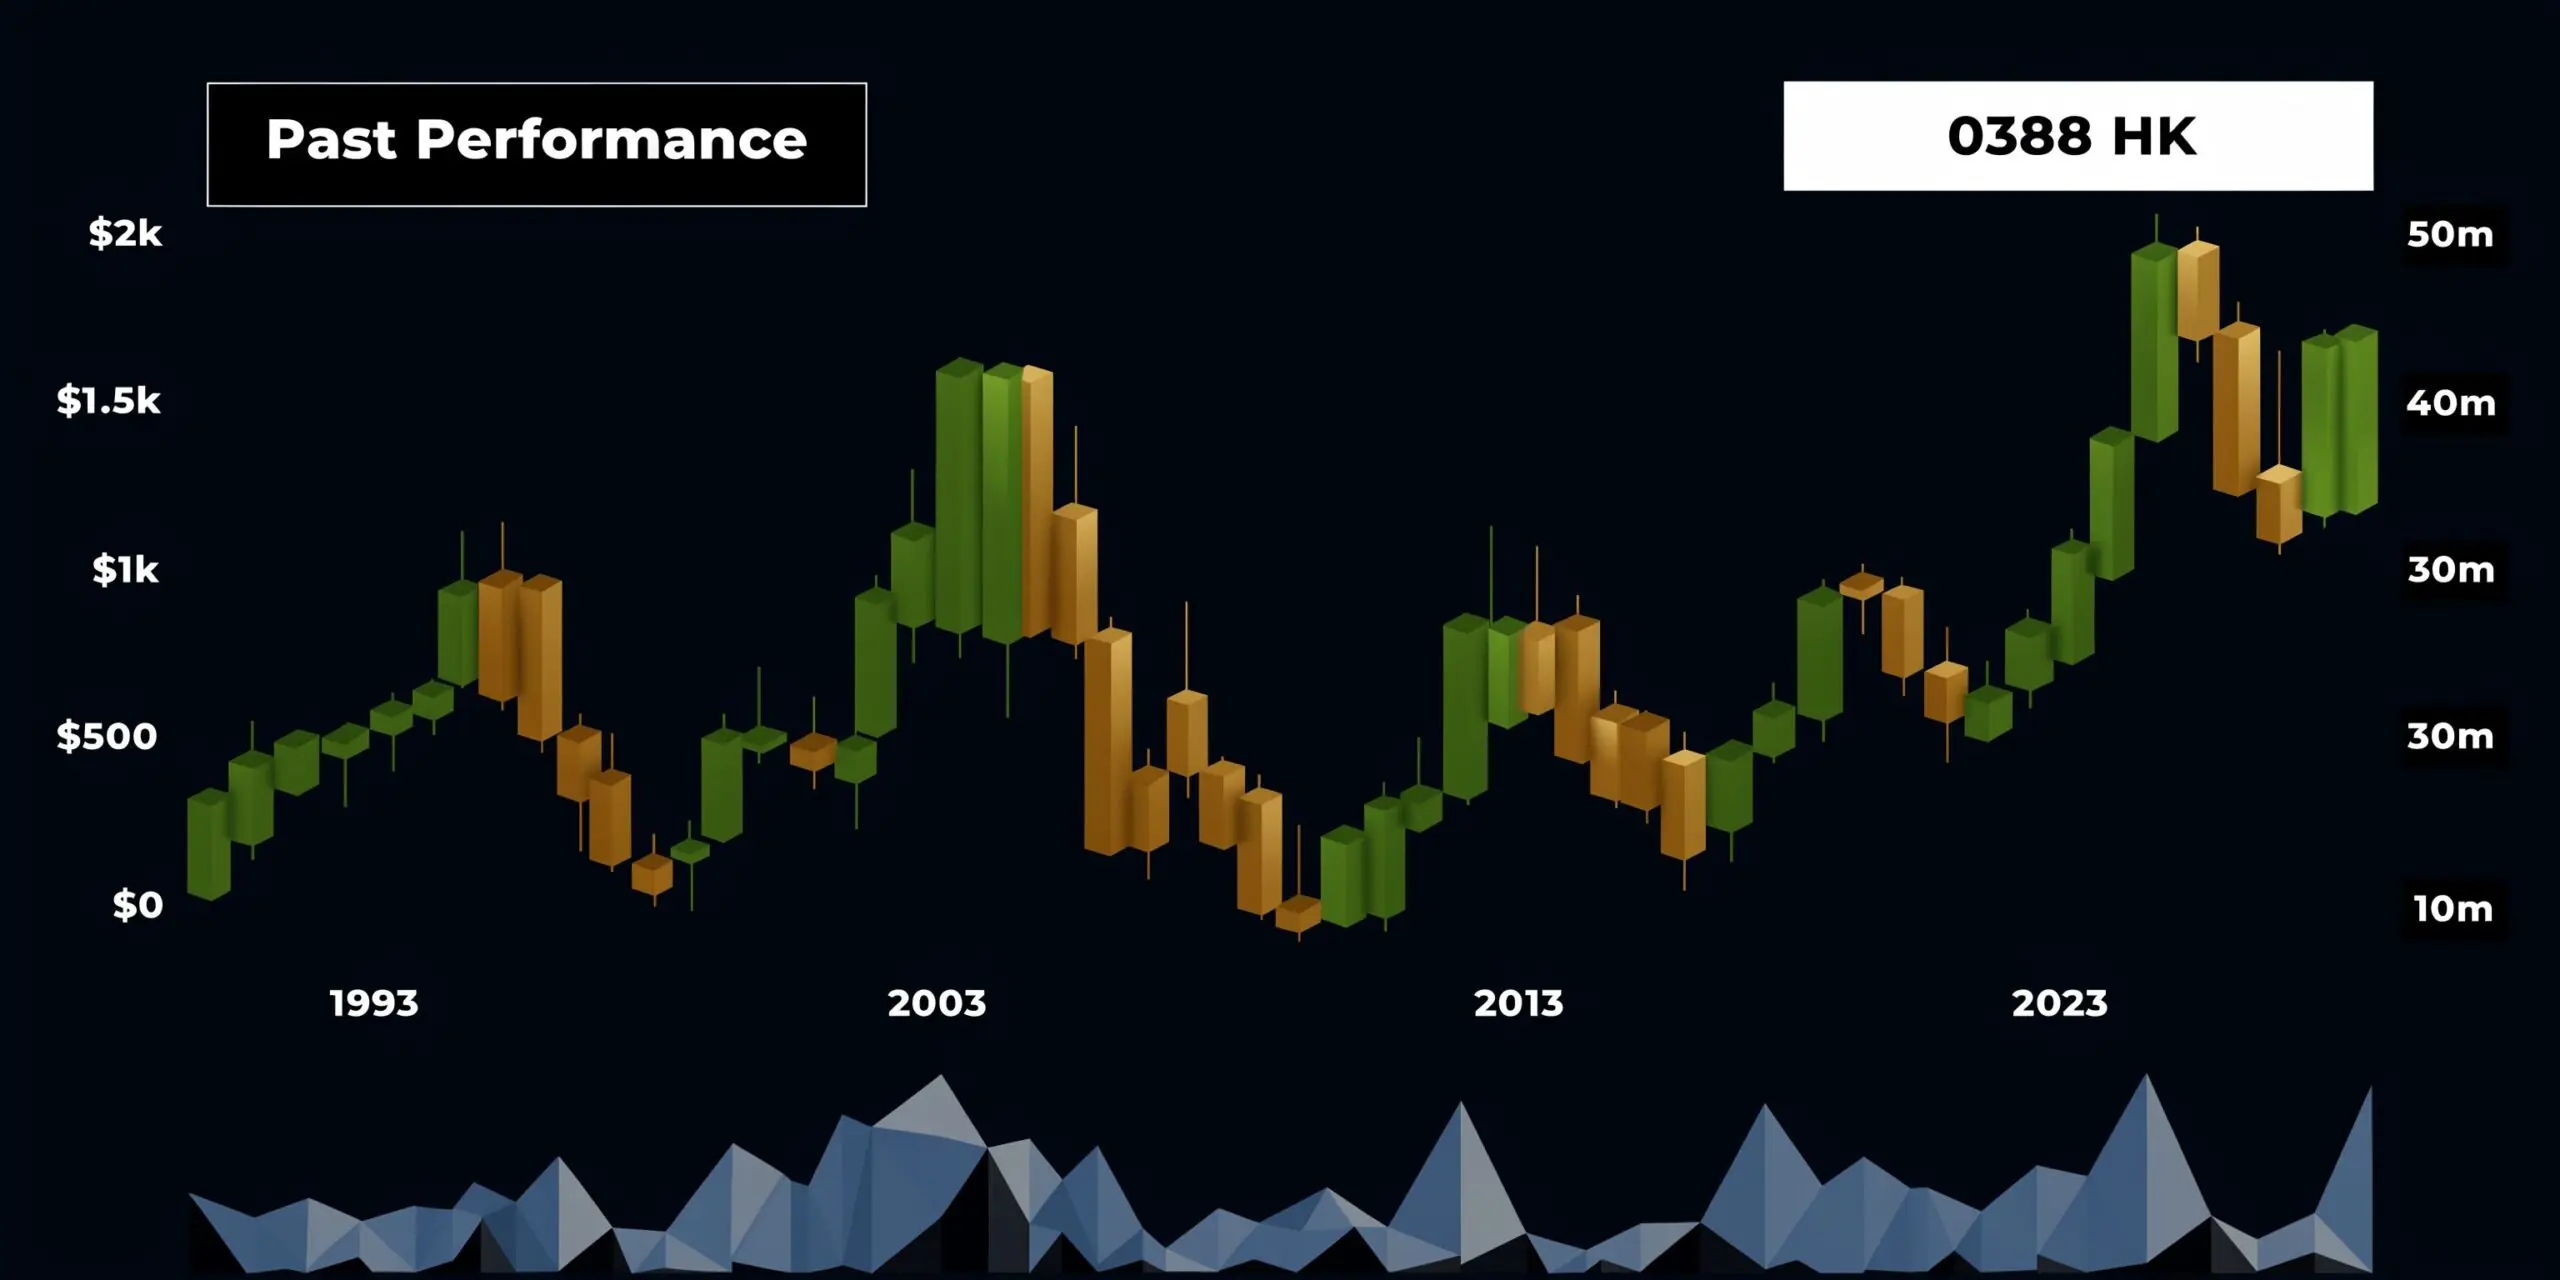
What the long-term chart says
HKEX has shown major long-term appreciation. Its lowest historical end-of-day price was HK$0.49 on September 17, 2001, and its highest historical end-of-day price was HK$64.18 on February 19, 2021, which amounts to about 13,000% appreciation over that period according to CompaniesMarketCap’s HKEX stock price history.
That kind of move tells you this isn’t a dead capital stock. It has a history of rerating higher over long periods.
Why recent price range matters more to traders
For a CFD trader, the long-term story is useful, but the recent operating range matters more day to day. As of April 2026, the stock was trading around HK$405 to HK$406, with a 52-week range of HK$283.20 to HK$466.00 from the same source above.
That range is wide enough to matter. It tells you the stock can move hard inside a single year, even when the underlying business remains respected.
A few practical takeaways:
- Don’t assume blue-chip status means low movement
- Don’t place lazy stops just because the company is established
- Don’t chase extended moves near range extremes without a plan
If you’re working out trade scenarios or reviewing payoff on stock moves, this guide on how to calculate profits in stocks helps frame the impact of price changes on your result.
What works and what doesn’t
What works is using the long-term chart as context. What doesn’t work is using it as a reason to ignore present-day risk.
A stock can have an excellent long-term record and still trap late buyers in the short term. That’s why experienced traders separate structural quality from timing quality.
Decoding Technical Signals for 0388 HK
The chart currently gives mixed but usable information. That’s often better than a chart where every indicator screams the same thing, because those setups usually attract crowded entries.
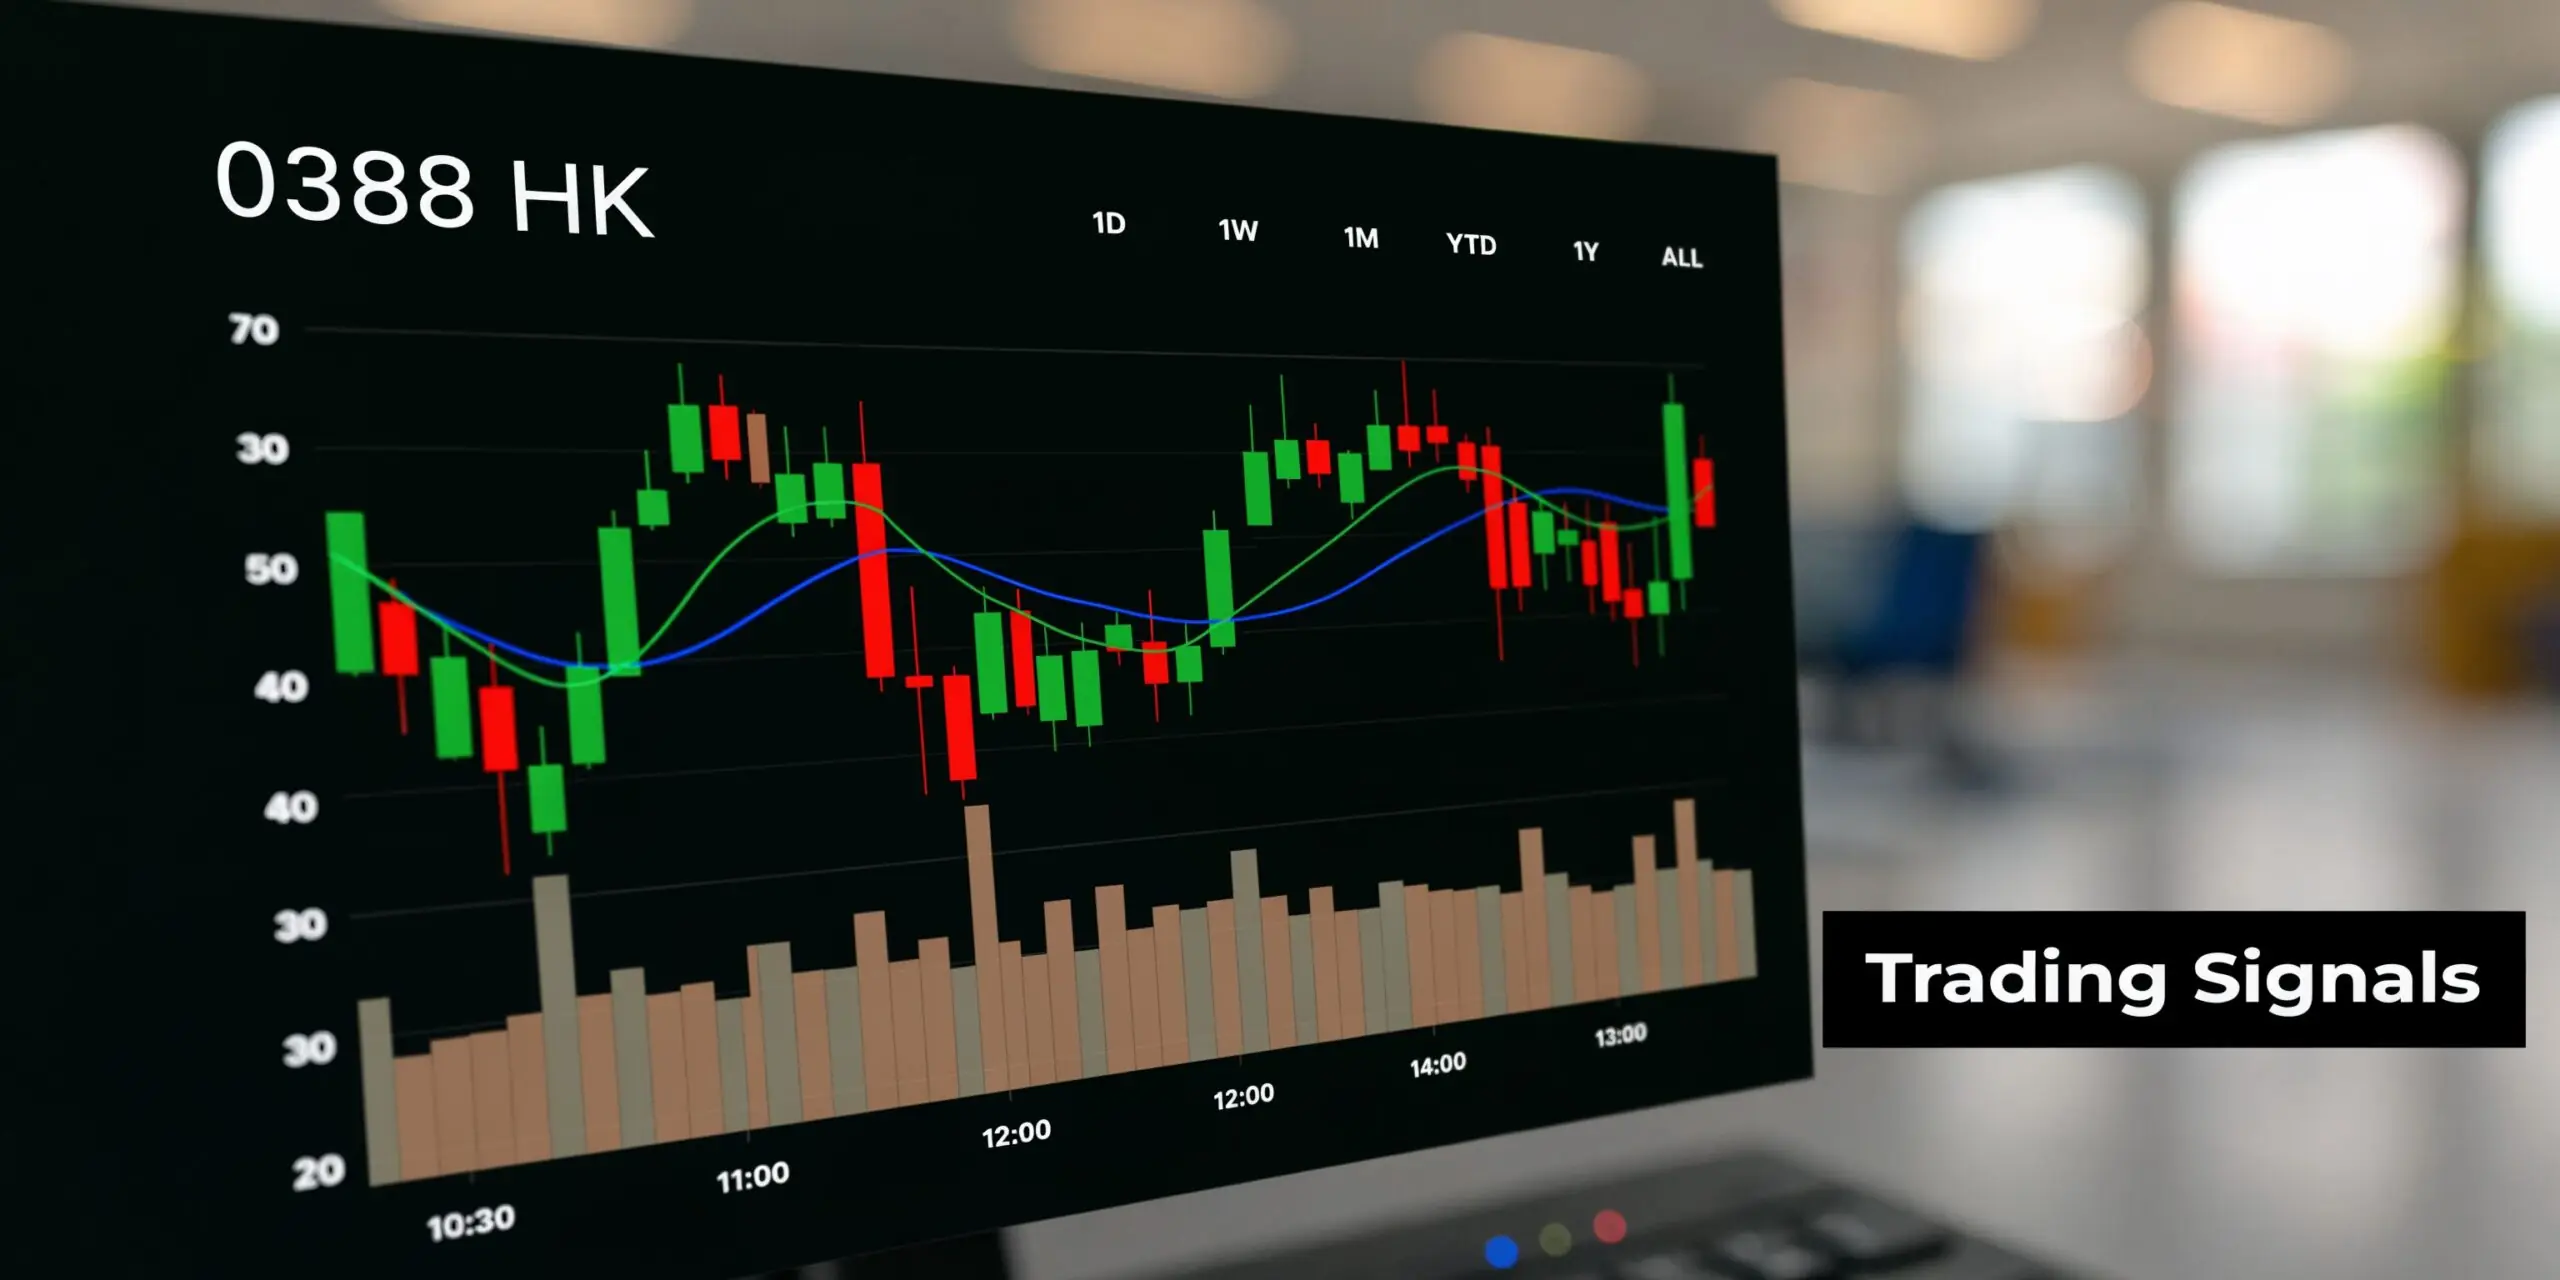
Current technical snapshot
Recent technical analysis shows the 14-day RSI at 54.433, which is neutral. At the same time, MACD (12,26) shows a Buy signal, ADX is 33.471, indicating a strong trend, and Classic Pivot Points show R1 at HK$429 and S1 at HK$427.6 according to Investing.com’s HKEX technical page.
That combination matters.
- RSI neutral means the stock isn’t obviously stretched in one direction by that measure.
- MACD Buy suggests positive short-term momentum.
- ADX above 33.471 tells you trend strength is present.
- Pivot levels give you practical intraday reference points.
How to read mixed signals properly
A junior trader often wants one clean answer. Buy or sell. Trend or fade. Markets rarely make it that easy.
With 0388, the more professional read is this:
- Momentum has support.
- The market isn’t in obvious overbought panic mode based on the cited RSI.
- Price still needs to behave well around key levels before you commit size.
That means a blind market order is usually the weaker choice. Better execution often comes from waiting for one of two things:
- A confirmed hold above an important level
- A pullback into support that gets defended cleanly
If you rely on intraday benchmark tools, understanding what VWAP is can help you judge whether a move is being accepted or fading back into average price.
When MACD says buy and RSI says neutral, don’t force certainty. Look for price confirmation.
A simple technical decision filter
Use this before taking a setup:
- Trend check. Is price respecting the broader directional structure?
- Level check. Are you entering near support, resistance, or in the middle of nowhere?
- Signal check. Are momentum tools aligned enough to support your trade idea?
- Risk check. Does your stop make sense relative to the setup, or are you forcing it to fit your account?
That last point matters most. A good chart can still be a bad trade if the stop distance makes the position size impractical.
How to Trade 0388 HK as a CFD A Practical Guide
Trading 0388 hk share price as a CFD is straightforward once you stop thinking about it like a stock investing account and start thinking in execution terms.
What a CFD trader actually needs to know
You don’t need to own the underlying shares. You’re trading the price movement.
That changes your focus:
- Entry precision matters more
- Holding costs matter if you keep positions open
- Position size matters more than conviction
- Overnight exposure needs a reason, not a hope
CFD prices are designed to track the underlying market closely, but your real trading outcome depends on your contract size, stop distance, and account risk.
The workflow that tends to work
A disciplined process usually looks like this:
Mark the chart first
Identify the level that matters and the point where the trade is wrong.Decide whether the setup is intraday or swing
Don’t blur the two. Intraday trades need tighter logic. Swing trades need more room and more patience.Check financing and holding conditions on your platform
If you might hold overnight or over the weekend, know the cost and the rule set before entering.Size the trade from the stop
Not from confidence. Not from how clean the chart looks.Place the stop immediately
If you’re planning to “manage it manually,” you’re already making the trade more fragile.
What works versus what doesn’t
What works
- Entering near a level where invalidation is clear
- Using smaller size when the stock is moving fast
- Treating overnight holds as a separate trade type
- Logging whether your edge comes from breakouts, pullbacks, or mean reversion
What doesn’t
- Buying after an impulsive move because the candle looks strong
- Holding a losing intraday trade overnight without a plan
- Using the same size on quiet days and volatile days
- Confusing a good company with a good immediate entry
Keep the mechanics boring
Professional CFD trading is usually boring in the right ways.
You open the chart. You define the setup. You calculate the stop. You adjust size. You know whether the position is worth holding after the session. If any of those are unclear, skip the trade.
That’s especially true with a stock like HKEX. The instrument is respectable. That doesn’t mean every candle deserves your capital.
Risk Management and Strategy for Funded Traders
Most traders fail at this point. Not on analysis. On position sizing.
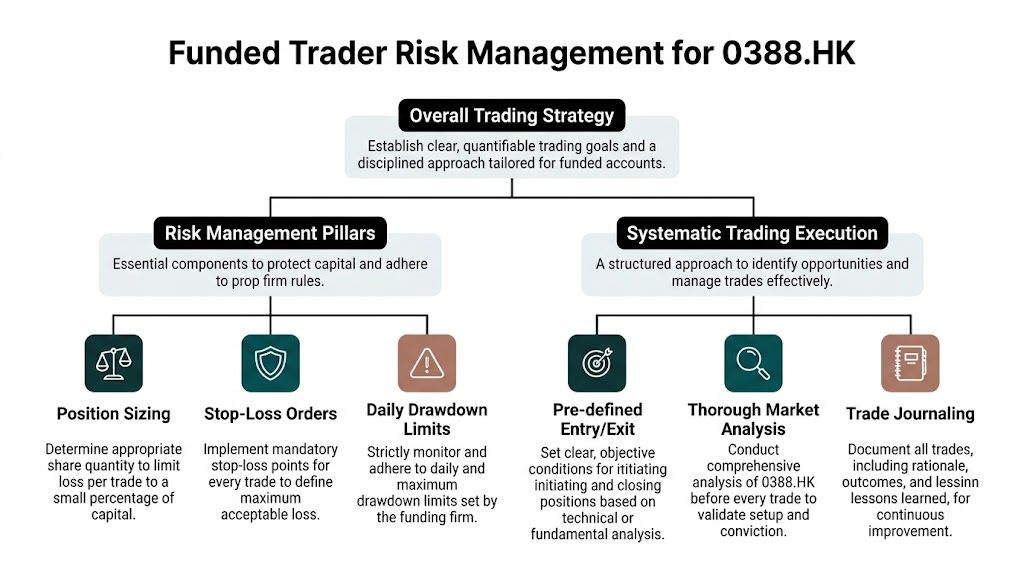
Start with the account rule, not the chart
Recent technical commentary on HKEX notes that the stock trades at a premium valuation, shows daily volatility of about 2% to 3%, has a 52-week range of HK$283.20 to HK$466.00, and is trading above key moving averages, which suggests bullish momentum but still demands careful risk control according to TradingView technicals for HKEX 388.
That one sentence should change how you size trades.
A stock with daily movement in that range can hit a poorly placed stop fast. If you’re trading under funded-account limits, your first job is preserving room to continue trading tomorrow.
A practical framework for 0388
Use a simple hierarchy.
Define the invalidation point
Your stop has to sit where the setup is wrong. Not where your account feels comfortable.
For 0388, that usually means placing the stop beyond a structure break, not randomly under your entry.
Let the stop determine size
Once the stop is set, adjust the number of shares or contract exposure downward until the loss fits your rule set.
That’s the professional order of operations.
Trade smaller when volatility expands
If the stock is moving more aggressively, the same chart pattern needs more room. More room means smaller size.
A lot of funded traders do the opposite. They see movement and increase size. That’s how a decent setup becomes a rule breach.
What disciplined execution looks like
- One setup, one risk plan. Don’t average down because the company is “too good to keep falling.”
- Respect the day’s tone. If price is reacting sharply around key levels, reduce size or pass.
- Avoid middle-of-range entries. They often offer the worst reward-to-risk.
- Cap your total exposure. Multiple attempts on the same instrument can create one oversized bet.
A funded trader’s edge isn’t just finding good entries. It’s staying solvent and compliant long enough for good entries to matter.
The mistake that blows accounts
The worst habit is forcing a stop so tight that normal price noise takes you out, then re-entering several times. That can create a chain of small losses that adds up faster than one properly sized trade would have.
A better approach is to decide in advance:
- Is this a breakout trade?
- Is this a pullback trade?
- Is this a range fade?
Each one needs a different stop location and different expectations. Mixing them is expensive.
Dividends Corporate Actions and News Impact
A stock CFD isn’t just affected by chart structure. Operational events matter too.
If you hold a CFD over a dividend event, brokers typically make a cash adjustment rather than handing you the underlying share ownership rights. The exact treatment depends on whether you’re long or short and how your platform handles corporate events. Check the instrument specification before you hold through those dates.
News risk matters just as much.
TradingView commentary identifies key support at HK$500, with deeper Fibonacci support at S1 HK$433.94 and S3 HK$425.53, and notes that for a trader with a 5% daily loss limit on a $100K account, or $5,000 risk, those levels matter for position sizing and rule compliance according to TradingView’s HKEX 388 market page.
That’s the practical point. Support levels aren’t just chart decorations. They affect whether you can carry size safely into news or corporate event risk.
Keep a simple event routine
- Check upcoming company announcements
- Know whether you’re holding through a dividend adjustment
- Reduce size into uncertain news if the trade is already extended
- Don’t assume support will hold just because many traders can see it
When the instrument is active and headline-sensitive, caution is part of the edge.
Frequently Asked Questions About Trading 0388 HK
What are the best hours to trade 0388.HK CFDs?
The best hours are usually when the underlying Hong Kong market is active and liquidity is more reliable. In practice, focus on periods when price is reacting cleanly around levels you already marked. Avoid forcing trades during thin or indecisive conditions just because the chart is open.
Is 0388.HK suitable for beginners?
Yes, but only if the beginner already understands basic risk control. HKEX is easier to respect than many speculative stocks because it’s a major financial name, but that doesn’t make it forgiving. Newer traders should start with small size, clear stop placement, and one setup type only.
Can I hold 0388.HK CFDs overnight or over the weekend?
You can, depending on your broker or platform conditions, but you should only do it deliberately. Overnight holds bring financing costs and event risk. Weekend holds add headline risk because price can reopen far from your expected level. If you don’t have a specific swing thesis, closing before the session ends is often the cleaner decision.
Should I trade 0388.HK from fundamentals or technicals?
Use both, but for different jobs. Fundamentals help you judge the quality and market perception of the stock. Technicals help you choose timing, risk placement, and execution. If the chart is poor, a good company can still be a bad trade today.
If you want to apply this with funded capital instead of only self-funding, explore the trading programs at MyFundedCapital. Compare the account types, review the risk rules carefully, and choose a challenge that fits your style. Trading involves risk of loss. This article is educational only and isn’t financial advice.
