
Recognizing when market momentum is fading can give you a serious edge, but many traders struggle to spot the signs. A wedge pattern signals that a trend is pausing and coiling up, often just before a major price move. This guide provides a practical framework for identifying and trading rising and falling wedges, helping you turn market indecision into actionable opportunities.

What Is a Wedge Trading Pattern?
A wedge trading pattern is a technical analysis formation where price action is squeezed between two converging trend lines. This tightening range indicates that volatility is decreasing and a battle between buyers and sellers is nearing its end. Recognizing a wedge pattern is like getting an early warning that the market's current indecision is about to resolve, often with a powerful breakout.
This structure is a critical piece of information. It signals that the prevailing trend is losing momentum and that a significant price reversal or a strong continuation is likely imminent.
Key Characteristics of a Wedge
To confidently identify a wedge trading pattern and distinguish it from random market noise, look for these specific traits:
- Converging Trend Lines: The two trend lines—one connecting the swing highs (resistance) and the other connecting the swing lows (support)—must be slanting in the same direction and moving closer together.
- Declining Volume: As the wedge forms, you should typically see trading volume decrease. This indicates that market participants are becoming hesitant at current price levels, building potential energy for the subsequent breakout.
- Two Main Types: Wedges come in two primary forms: the rising wedge, which is a bearish pattern, and the falling wedge, which is a bullish pattern.
Learning to spot these formations is a core skill. Wedges are just one of many powerful chart patterns in forex that provide a structured way to plan trades. When you correctly identify a wedge, you identify a high-probability setup with a clearly defined risk before the main move occurs.
How to Identify Rising and Falling Wedge Patterns

Before you can trade a wedge, you must know how to spot one correctly on your charts. While rising and falling wedges can look similar, they signal very different potential outcomes. Getting this distinction right is crucial for your trading strategy.
The Anatomy of a Rising Wedge Pattern
A rising wedge is a classic bearish pattern that often signals a potential reversal during an uptrend. It suggests that buying pressure is beginning to wane.
Here’s what to look for on your chart:
- Two Upward-Sloping Trend Lines: Both the support line (connecting the lows) and the resistance line (connecting the highs) are pointing up.
- Converging Lines: The critical detail is that the support line is steeper than the resistance line. This creates a "squeezing" effect as the price moves higher.
- Higher Highs and Higher Lows: The market is still technically making new highs and lows, but the advances become smaller and appear weaker, indicating fading upward momentum.
This structure tells a story: buyers are still present, but they are losing their grip. The loss of upward momentum often precedes a sharp breakdown through the support line.
The Anatomy of a Falling Wedge Pattern
A falling wedge is a bullish pattern. It can appear at the bottom of a downtrend to signal a reversal or during an uptrend as a consolidation before the next move higher. It tells you that sellers are losing control and buyers may be preparing to take over.
To spot a falling wedge, look for these traits:
- Two Downward-Sloping Trend Lines: Both the support and resistance trend lines are clearly pointing down.
- Converging Lines: For a falling wedge, the resistance line is steeper than the support line. This tightening shows that sellers are unable to push the price down as aggressively as before.
- Lower Highs and Lower Lows: The price continues to make new lows, but each decline is shallower than the last. The selling pressure is visibly fading.
A key validation rule for any wedge is that each trend line should have at least two, and ideally three, confirmed touches. Three touches provide stronger confirmation that you're dealing with a genuine pattern and not just random price action.
Rising Wedge vs. Falling Wedge At a Glance
| Characteristic | Rising Wedge | Falling Wedge |
|---|---|---|
| Pattern Type | Bearish | Bullish |
| Trend Line Slope | Both slope up | Both slope down |
| Steeper Line | The support line | The resistance line |
| Price Action | Makes higher highs and higher lows | Makes lower highs and lower lows |
| Implied Outcome | Price is likely to break down | Price is likely to break up |
The Critical Role of Volume
If price action tells you what is happening, volume tells you the conviction behind it. Volume is a crucial confirmation tool for the wedge trading pattern.
- Declining Volume: As the wedge forms and price contracts, trading volume should noticeably decrease. This shows a loss of momentum from the dominant group (buyers in a rising wedge, sellers in a falling one).
- Breakout Volume Spike: When the price finally breaks out of the pattern, you need to see a significant increase in volume. This surge confirms that institutional capital may be backing the new direction, which increases the probability of a successful follow-through.
A pattern with decreasing volume during formation followed by a high-volume breakout is the textbook signature of a high-probability setup. Without volume confirmation, the pattern is far less reliable. All trading involves risk, and no pattern guarantees profits.
Understanding the Psychology Behind the Wedge Pattern
Wedge patterns are more than just lines on a chart; they are a visual representation of the struggle between buyers and sellers. Understanding the psychology driving the price action can provide a significant edge. You are watching market sentiment shift in real-time.
The Psychology of a Rising Wedge
A rising wedge typically forms after a strong uptrend. Initially, buyers are in control, but a shift begins to occur.
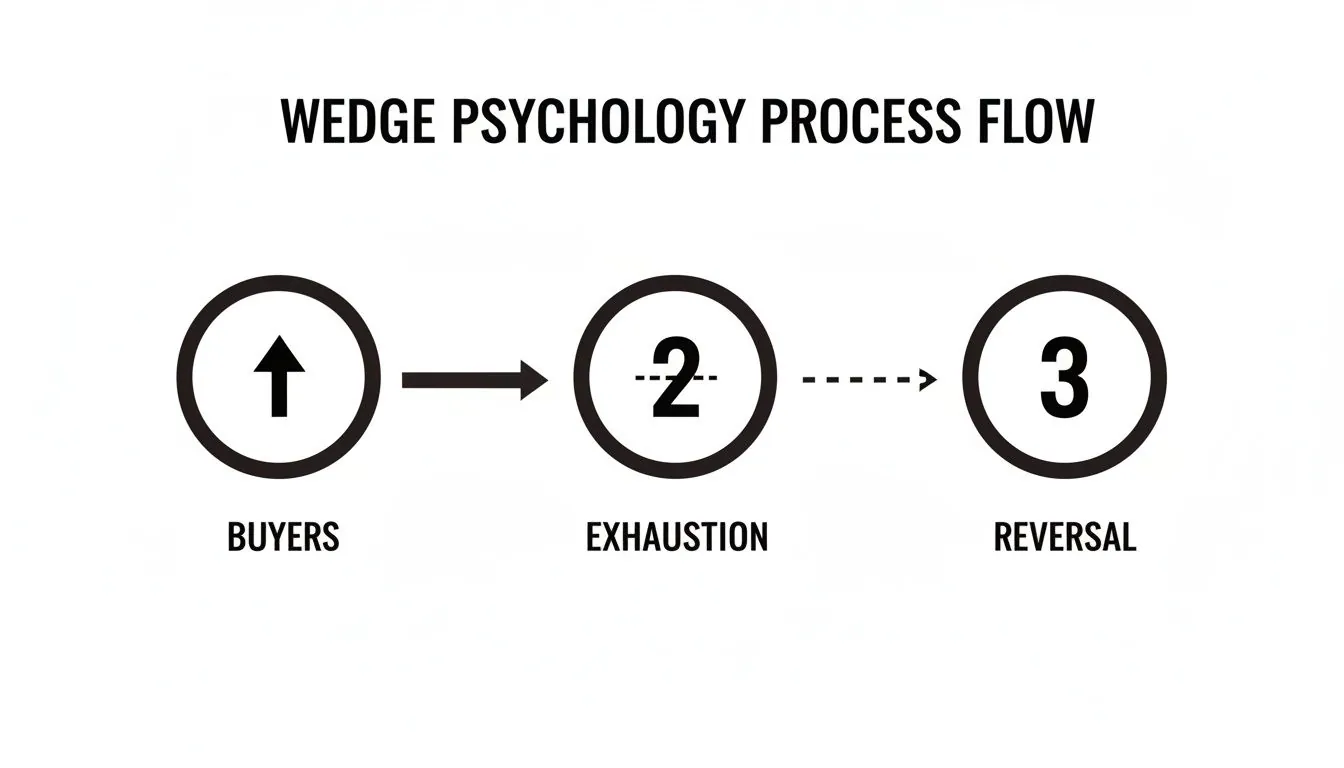
- Buyer Exhaustion: Each new high barely surpasses the previous one. This indicates that buying power is fading.
- Growing Seller Confidence: Sellers start to enter the market a little earlier on each rally. The higher lows show that buyers are defending their positions, but the tightening price range reveals a struggle.
The narrowing action of a rising wedge illustrates mounting doubt. The tension builds until the support trendline finally breaks, often resulting in a sharp, fast drop as exhausted buyers capitulate and sellers take control.
The Psychology of a Falling Wedge
A falling wedge tells the opposite story: sellers are losing momentum, and buyers sense an opportunity. These patterns usually appear after a downtrend.
- Fading Seller Momentum: Sellers continue to push, but each new low is less significant than the last, a clear sign that selling pressure is diminishing.
- Emerging Buyer Interest: Buyers begin to see value and start absorbing sell orders, which prevents the price from falling further.
This standoff between weakening sellers and emboldened buyers is the essence of a falling wedge. When the price finally breaks through the upper resistance line, it confirms that sellers have capitulated. This breakout often triggers a quick rally. A solid grasp of market psychology is a vital skill for any trader, and it's worth taking the time for developing a trading mindset.
A Step-by-Step Plan for Trading Wedge Patterns
Having a clear, actionable plan is essential for trading wedges effectively. A solid plan helps remove emotion and guesswork, promoting the discipline required for consistent trading. The following is a practical framework for trading any wedge pattern you identify. This content is for educational purposes only and is not financial advice.
Step 1: Confirm the Pattern Is Valid
Before risking capital, you must ensure you are looking at a legitimate wedge trading pattern. Use this validation checklist:
- Converging Trend Lines: The support and resistance lines must be squeezing toward each other. In a rising wedge, both lines angle up, with the support line being steeper. In a falling wedge, both lines angle down, with the resistance line being steeper.
- At Least Three Touches: For a pattern to be statistically more reliable, price should test each trend line at least two times, though three is much better.
- Declining Volume: As price compresses inside the wedge, volume should be decreasing. This is a strong clue that the group in charge is losing momentum.
If a setup doesn't meet all three of these criteria, it may be better to wait for a clearer opportunity. You can read more on how to interpret these powerful patterns to see more examples.
Step 2: Define Your Entry Trigger
A common mistake is entering a trade before the breakout is confirmed. A professional trader waits for the market to validate the setup.
- The Breakout Candle: A reliable entry trigger is the close of a full-bodied candle outside the pattern. For a rising wedge, this means a solid candle closing below support. For a falling wedge, it's a candle closing above resistance.
- The Volume Spike: The breakout should be accompanied by a significant increase in volume. This provides confirmation that conviction is behind the move. A breakout on weak volume is a major red flag and suggests a higher risk of failure.
Step 3: Set Your Stop-Loss
Every trade needs a stop-loss to manage risk. Wedges provide a logical placement for this crucial order.
- For a Rising Wedge (Short Trade): Place your stop-loss just above the last swing high inside the wedge.
- For a Falling Wedge (Long Trade): Place your stop-loss just below the last swing low inside the wedge.
This placement defines your risk and allows for a quick exit if the breakout turns out to be a fake-out.
Step 4: Project Your Profit Target
Wedges offer a practical method for setting a logical initial profit target.
- Measure the Base: At the start of the pattern, measure the vertical distance between the support and resistance lines at their widest point.
- Project from the Breakout: Project that same distance from the breakout point in the direction of the trade.
For example, if the base of a falling wedge measures 200 pips, your minimum profit target would be 200 pips above the breakout point. A common strategy is to take partial profits at this first target and move your stop-loss to your entry point, creating a risk-free trade.
Real-World Wedge Pattern Trade Examples
Theory is one thing, but analyzing real trades is where the lessons truly sink in. Let's dissect both a winning and a losing wedge pattern trade to see how these setups perform under real market conditions. Remember that past performance is not indicative of future results.
Example 1: A Winning Falling Wedge on BTC/USD
This example on the Bitcoin 4-hour chart shows how a patient, disciplined approach can lead to a successful trade.
- Identification: After a sharp drop, BTC/USD formed a clear falling wedge with at least three touches on each trend line. Volume decreased as the wedge tightened, signaling seller exhaustion.
- Entry: The entry was triggered by a strong 4-hour candle close above the upper trend line at $62,500. This breakout was accompanied by a large spike in volume, confirming buyer interest.
- Stop-Loss: The stop-loss was placed below the last swing low within the wedge at $60,800, limiting the risk to approximately 2.7%.
- Profit Target: The widest part of the wedge was measured at about $4,000. Projecting this from the breakout gave a minimum target of $66,500. The price exceeded this target, delivering a reward-to-risk ratio of over 2.3-to-1.
Example 2: A Losing Rising Wedge on XAU/USD (Gold)
Analyzing losing trades is crucial for improving risk management. Here is a rising wedge on the Gold 1-hour chart that failed.
- Identification: Gold formed a clear rising wedge during a short-term climb. Volume was tapering off, suggesting a potential bearish breakdown.
- Entry: A short trade was triggered when a 1-hour candle closed below the support line at $2,350.
- Stop-Loss: A stop-loss was correctly placed above a recent swing high inside the wedge at $2,365.
- The Failure: Soon after the breakdown, buyers re-entered the market and pushed the price back above the broken support line. The stop-loss at $2,365 was hit, and the trade was closed for a small, controlled loss.
This example highlights the importance of risk management. The disciplined use of a stop-loss prevented a small loss from becoming a major drawdown. A failed pattern is a statistical reality of trading, not a personal failure.
Applying Wedge Strategies in a Prop Firm Environment
Trading with a prop firm like MyFundedCapital requires disciplined risk management, making the wedge trading pattern an excellent fit. The clear, rule-based nature of wedges aligns perfectly with the consistency that prop firms look for.
Aligning Wedges with Drawdown Rules
The biggest challenge for many prop firm traders is managing drawdown. Daily and maximum loss limits are strict. Wedge patterns provide a logical, built-in location for your stop-loss.
- Rising Wedge (Short): Stop-loss is placed just above the last swing high.
- Falling Wedge (Long): Stop-loss is placed just below the last swing low.
This allows you to pre-define your risk on every trade. You can adjust your position size to ensure any single loss remains well within your risk limits, such as a 5% daily drawdown.
Using Profit Targets to Reach Challenge Goals
Passing a funding challenge requires hitting a specific profit target, like 8% or 10%. The wedge pattern’s "measured move" technique provides a logical target to work toward. By projecting a realistic target based on the pattern's height, you can systematically build equity and demonstrate your ability to execute a trading plan. If you're new to the space, understanding how funded trading accounts work will show you how critical this structured approach is.
Instrument Selection and Execution
MyFundedCapital offers over 300+ instruments, but it's wise to specialize. Focus on a handful of liquid markets known for clean wedge patterns, such as major FX pairs (EUR/USD, GBP/USD) or major indices (S&P 500). Additionally, staying aware of market-moving news, like Binance announcements for crypto, can help you anticipate volatility that might affect your trades.
Answering Your Top Questions About Wedge Patterns
Here are answers to some of the most common questions traders have about the wedge trading pattern.
What’s the Main Difference Between a Wedge and a Triangle Pattern?
The key difference is the slope of the trend lines.
- In a wedge pattern, both trend lines slope in the same direction (either both up or both down).
- In a triangle pattern (like a symmetrical triangle), one trend line slopes down and the other slopes up, converging towards each other.
A wedge typically signals a trend that is losing momentum, while a triangle often represents pure consolidation before a continuation of the prior trend.
How Long Does a Wedge Pattern Typically Take to Form?
There is no fixed duration. The time frame depends on the chart you are viewing. A wedge might form over a few hours on a 15-minute chart or take months to develop on a weekly chart. A general guideline is that a reliable wedge often contains between 20 and 75 candles. Patterns that are too short may be market noise, while those that are too long may lose their predictive power.
What Happens If a Wedge Pattern Fails?
A failed pattern, or "fakeout," occurs when price breaks out but quickly reverses back inside the pattern. This can be a powerful signal in itself. A failed breakout often indicates that the market is preparing to move strongly in the opposite direction. For example, if a rising wedge breaks down but the price then rallies back above the former support line, it is often a strong bullish signal.
Can I Combine Other Indicators with Wedges?
Yes, combining wedges with other indicators for confluence can increase the probability of a successful trade.
- Relative Strength Index (RSI): Look for RSI divergence. For a rising wedge, bearish divergence (higher highs in price, lower highs in RSI) is a strong confirmation. For a falling wedge, look for bullish divergence (lower lows in price, higher lows in RSI).
- Moving Averages: A breakout from a wedge that also clears a major moving average (like the 50-period or 200-period) is a much stronger signal.
The goal is to use one or two familiar indicators for confirmation, not to overcomplicate your charts.
Ready to apply what you've learned about the wedge trading pattern with simulated capital? At MyFundedCapital, we provide traders with the funding to prove their skills and earn real payouts based on their performance.
Compare our funding programs and find the right challenge for your trading style.