

 AR
AR
 NL
NL
 FR
FR
 DE
DE
 ES
ES
 IT
IT
 PL
PL
 SV
SV
 PT
PT

You're staring at a fast-moving index chart, the candles are jumping, and you can't tell whether you're looking at a real opportunity or just noise. That's where most beginners get caught; they focus on the move but miss the structure behind it, the position size underneath it, and the costs eating the trade. Indices trading for beginners gets a lot easier once you understand what you're trading, how to size risk, and why a tight stop can still create a very large position.
What Market Indices Are
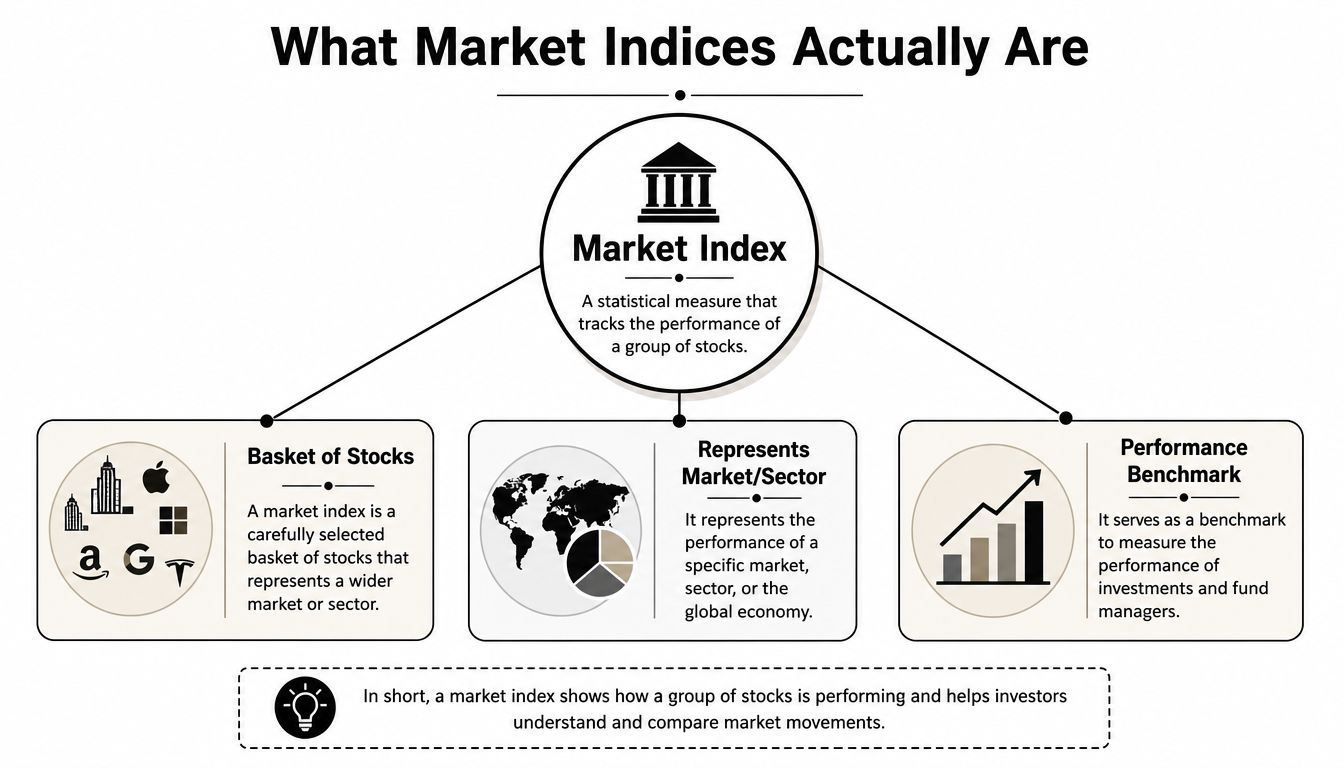
A market index is a basket of stocks built to represent a market, sector, or theme, not a single company. That matters for beginners, because trading an index means you are taking a view on the combined movement of many constituents, not on one earnings report or one CEO comment. The S&P 500 is commonly used as a broad U.S. market barometer, the FTSE 100 tracks the 100 largest companies on the London Stock Exchange, and the Germany 40 is another major global index traders watch closely.
Why indices matter
Indices matter because they turn a messy market into a readable signal. If a few large companies are pulling an index lower, the benchmark reflects that collective pressure, especially when it is market-cap weighted, where bigger companies have more influence on movement.
An index works like a market thermometer. It does not show every detail about every stock, but it does show whether the overall temperature is rising or falling. That is why index funds and benchmarks are used so often to compare performance, track sectors, and judge whether broad sentiment is improving or deteriorating.
Practical rule: If you cannot explain what the index is made of, you are probably trading the chart without understanding the exposure.
Beginners also confuse index trading with “buying the market.” Sometimes that is true in the investing sense, but active traders are often speculating on short-term direction, volatility, or session momentum. The index is the wrapper, the constituents are the engine, and the weighting method is what makes one index behave differently from another.
If you want a clean primer on the mechanics, this overview of what index trading is is worth reading once you have the basics straight. The more clearly you understand the basket behind the price, the less likely you are to treat index movement like random noise.
Three Ways to Trade Indices and Which Fits Beginners
The three common ways to trade indices are CFDs, futures, and ETFs. They all give you exposure to the same underlying market theme, but they behave very differently in terms of potential amplification of returns and losses, capital needs, and execution. For a beginner, the vehicle matters as much as the direction call, because the wrong instrument can magnify a small mistake into a big account hit.
CFDs, futures, and ETFs side by side
| Feature | CFDs | Futures | ETFs |
|---|---|---|---|
| Ownership | No ownership of the basket | Standardized exchange contract | Shares of a fund that tracks the index |
| Leverage | Often available, cuts both ways | Typically leveraged by contract design | Usually no direct leverage for the retail holder |
| Flexibility | High, position size can be adjusted closely | Less flexible, contract specs are fixed | Simpler, but less tactical |
| Suitability for beginners | Often the most accessible for practice | Better after you understand contract details | Good for passive exposure, not active short-term trading |
CFDs let you speculate on index movement without owning the underlying basket. That flexibility helps with sizing, but their inherent magnification of outcomes makes them dangerous when you're still learning, because losses can grow just as fast as gains. Futures are standardized contracts with expiration dates and contract specifications you need to understand before you touch them, which makes them more technical than many newcomers expect. ETFs are the simplest way to get exposure, but they're not built for active intraday-style trade management in the same way.
What usually trips beginners up
The trap isn't the instrument itself; it's the mismatch between the trader's intent and the product's behavior. Someone who wants a quick directional trade may accidentally choose an instrument that requires margin discipline and contract awareness. Someone who wants simple market exposure may choose a product that offers too much magnification and too much temptation.
A sensible first filter looks like this:
- If you want flexibility, CFDs are usually the most practical starting point.
- If you want exchange-traded structure, futures are more formal but demand more study.
- If you want simple exposure, ETFs are cleaner, but they're not the same thing as active trading.
For beginners, a demo account with CFDs is often the least painful place to learn how index pricing, magnified trading power, and order placement function. The key is to treat that practice as training, not entertainment.
Setting Up Your Platform and Understanding Order Types
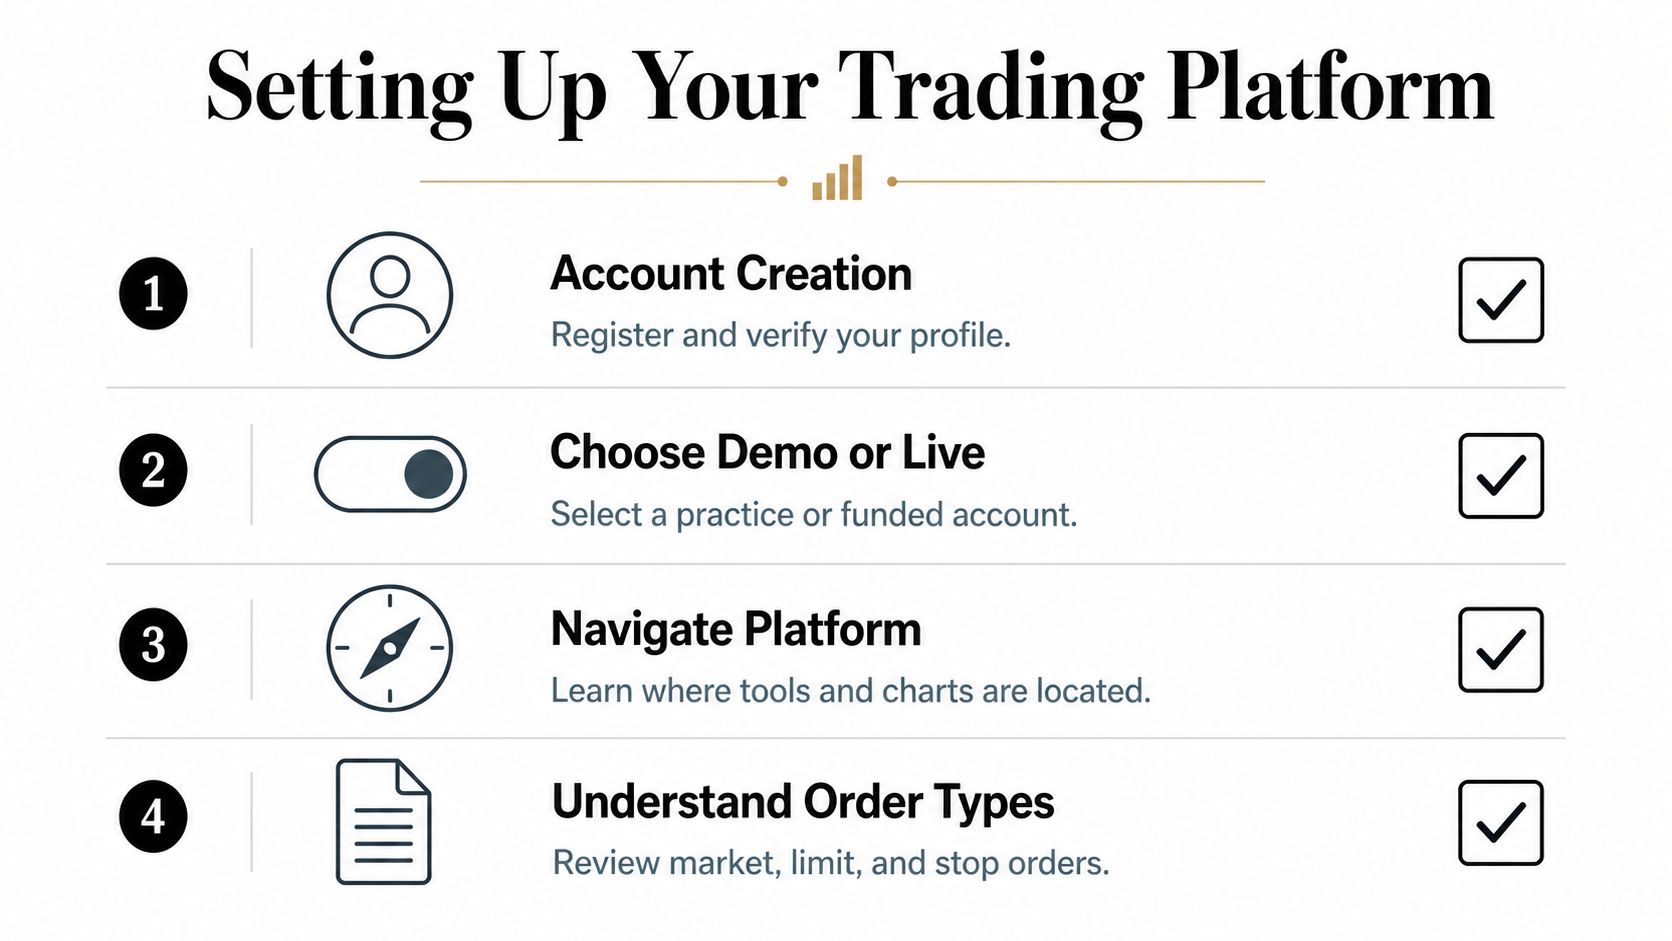
A beginner's first loss often starts before the trade is placed, with a rushed setup and a position that is too large for the account. The fix is usually simpler than people expect, create the account, use demo first while you learn execution, and spend time finding the instruments you plan to trade, such as US 500, US Tech 100, and Germany 40. Before any live order, click through the platform until opening and closing a trade feels familiar, because hesitation in the trade ticket can cost more than a weak chart entry.
The Four Essential Order Types
- Market order: Executes right away at the best available price. If the S&P 500 is moving quickly and you want immediate exposure, this gets you in fastest, though the fill may be less clean than expected.
- Limit order: Opens only at your chosen price. If you want to buy after a pullback, this keeps you from chasing a move that has already run.
- Stop-loss order: Closes the trade if price moves against you. If you buy the S&P 500 after a trend pullback, a stop below the recent swing low caps the damage if the market turns.
- Take-profit order: Closes the trade when your target is reached. If your plan calls for a specific move, this prevents you from staring at the chart and guessing when to exit.
Trading hours deserve the same attention. Major cash index CFDs often trade for much longer than the underlying exchange session, which can lead beginners to assume every hour offers the same quality of movement. The US 500 CFD is shown as open from Sunday 12:00 a.m. to Friday 9:00 p.m., with a daily break from 9:00 p.m. to 10:00 p.m., while the underlying exchange session is listed as 1:30 p.m. to 8:00 p.m. or 2:30 p.m. to 9:00 p.m. depending on the contract listing (Capital.com market guide).
Market access and good trading hours are different things. CFD availability is wider than the exchange session, but that extra time does not make every candle worth trading.
If you are comparing platforms, the page on MetaTrader 4 vs MetaTrader 5 can help you judge which interface fits your workflow. The goal is plain, know how to open, manage, and close a trade before you think about increasing size.
Position Sizing and the Hidden Costs of Trading Indices
Beginner accounts usually break at this point. A trader sees a tight stop and feels protected, then opens a position so large that a normal swing does real damage. With index CFDs, point value, stop-loss distance, and contract size work together to determine the actual risk on the trade, not the feeling of risk.
A tight stop can be misleading. On a volatile index, a small stop often forces a bigger position size than beginners expect, because the trade still has to fit within a fixed cash risk. That is why the first question should always be, how much can I lose on this trade, not how close can I place the stop.
The math behind a trade
The simplest way to approach it is to set your cash risk first, then define the stop distance, then calculate the position size. If you risk 1% of a $10,000 account, that is $100. If your stop is 20 points away, your trade size has to be set so that a 20-point move equals a $100 loss at most, not more.
That is the part beginners often miss. A small stop on a fast-moving index does not automatically mean a small trade. It can mean the opposite, because each point becomes more expensive as size increases, and that is where oversizing starts to happen.
The same idea is echoed in beginner risk guidance that recommends a 1–2% stop-loss per trade and limiting exposure to 1–2 open index trades while you are still learning (SGChain's beginner guide). That is a useful guardrail because index volatility can make oversized positions look harmless right up until the candle moves against you.
Practical rule: If you cannot calculate your worst-case loss in seconds, the position is too big.
The costs most guides skip
The hidden costs are usually spread, overnight financing, and slippage during fast sessions. A setup can look valid on the chart and still be unattractive once those costs are included. A tight stop on a volatile index can also force a larger position than you expected, which is why position size must come from risk, not from how “good” the chart feels.
A beginner who only checks the chart often forgets the execution side. The entry price may be a little worse than expected, the spread may widen during active periods, and holding overnight can add financing costs that were not part of the original plan. Those details do not need to be dramatic to matter, they just need to be ignored.
If you want to practice the arithmetic before you risk real money, a position size calculator is a good tool to use alongside your journal. For a broader framework on exposure and trade sizing, 8 position sizing strategies for prediction markets offers useful ideas that can still help you think clearly about risk, even though the market context is different.
A simple sizing checklist
- Define account risk first: Pick the money amount you are willing to lose on the trade.
- Measure the stop: Count the points from entry to invalidation.
- Check point value: Know what each point is worth in your contract.
- Account for costs: Spread and financing can change the actual outcome.
If the math feels slow at first, that is normal. The goal is not to guess your way into a trade. The goal is to know the loss before you click buy or sell.
Industry beginner guidance commonly recommends keeping risk around 1 to 2% of capital per trade, and that habit matters more than any indicator setup. The traders who survive the first 90 days are usually the ones who size down early and stay consistent long enough to learn what their strategy does under stress.
A Simple Trend-Following Strategy for Index Beginners
The cleanest beginner setup is the one that keeps you out of noise. Use a direction filter first, then a momentum trigger second. That means moving averages tell you the broader trend, and an oscillator such as RSI helps you avoid entering after the move is already stretched.
A basic long setup
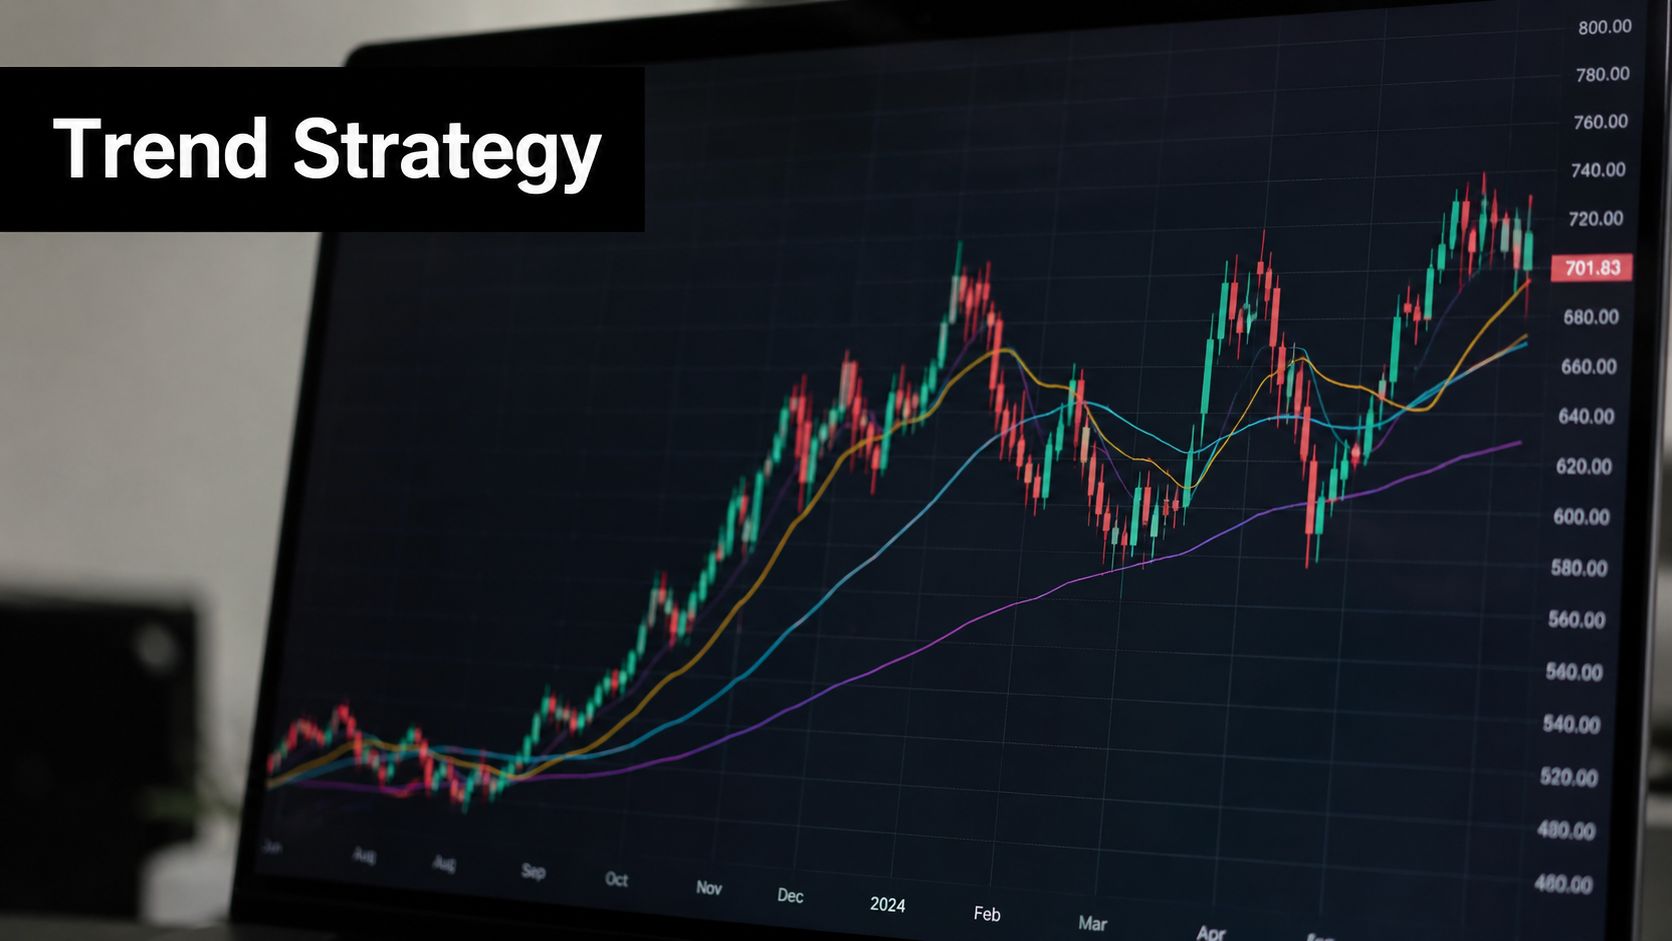
Start with the 20-period and 50-period moving averages. If both are pointing up and price is pulling back inside that uptrend, you're dealing with trend alignment rather than random motion. Then wait for RSI to dip out of the overbought zone or pull back to a more neutral area before turning back up, which gives you a better entry than chasing the first green candle.
The logic here is simple. Moving averages smooth noise and show direction, while oscillators help you catch exhaustion during a pullback. That combination is a practical starting point for beginners because it keeps the trade aligned with the market rather than fighting it.
Entry, stop, and target
Use these rules on a demo chart:
- Trend filter: The 20-period and 50-period moving averages are both rising.
- Pullback: Price retreats without breaking the broader structure.
- Trigger: RSI turns back up after a temporary dip.
- Stop-loss: Place it below the recent swing low.
- Take-profit: Aim for at least 1.5 times the stop distance.
A setup like this won't win every trade, and it doesn't need to. The point is to build positive expectancy across a series of trades, not to prove you can predict every candle. Journaling matters here, because if you don't record why you entered, where you stopped out, and whether the trend filter was valid, you'll confuse luck with skill.
What to write in your journal
- Market and session: Record which index you traded and when.
- Setup quality: Note whether moving averages and RSI agreed.
- Risk used: Write down the cash risk before the trade.
- Outcome: Capture whether the trade followed the plan or not.
That habit sounds basic, but it's one of the few ways beginners turn random trades into usable data.
From Demo Trading to Funded Accounts
Demo trading isn't a warm-up you skip once you feel confident; it's where you learn execution without paying tuition in live losses. Before moving to live capital, build a record of at least 50 demo trades, because that gives you enough samples to see whether your strategy and your discipline hold up under routine conditions. Anything less usually means you're judging the first few outcomes, not the process.
Why the demo phase matters
A demo account lets you practice the parts many traders underestimate. You learn how fast index prices move, how slippage feels during active hours, and how often your emotions try to override your plan. That matters more than finding the perfect setup, because a flawed process scaled up with real money gets expensive fast.
For traders who want external structure, a prop firm challenge can be the next logical step. MyFundedCapital offers Instant Funding, plus 1-Step and 2-Step Challenges, with indices available as part of its tradable instrument list on its funded trading accounts. The account structure includes a 5% daily loss limit and up to 10% maximum drawdown, which makes risk boundaries explicit before live-style trading begins.
What to look for before you scale
- Clear loss limits: Know the daily and total drawdown rules before you start.
- Transparent execution: Make sure the platform matches your routine.
- Instrument access: Confirm that indices are available on the account type you want.
- Process fit: Choose a challenge structure that matches your trading pace.
The point of a funded account isn't to bypass discipline, it's to prove it. If your demo results only work when you oversize or break your own stop, then a challenge won't fix the problem, it'll just expose it faster. In the first 90 days, the traders who improve most are usually the ones who keep the position size small, keep the rules visible, and let the track record build before they ask for more capital.
Common Beginner Questions About Indices Trading
Can I trade indices with a small account
Yes, but small accounts make risk control more important, not less. If you're trading through CFDs, a small account can disappear quickly if you size too aggressively, so the first job is to keep each trade's cash risk controlled. A small account is only workable when the position size is based on the stop, not on what you hope the move will become.
What is the best time of day to trade indices
The best time is usually when your chosen index has enough liquidity and clean movement for your strategy, not just when the platform is open. CFD availability can stretch beyond the underlying exchange session, but the quality of the move still varies by session, news flow, and volatility. If your setup depends on momentum, trade the hours when the market is moving with purpose.
How do indices differ from forex pairs
Forex pairs compare one currency against another, while indices represent a basket of stocks. That means forex is driven more by macro policy, rates, and currency flows, while indices are tied to broad equity sentiment, sector rotation, and the constituents inside the basket. The chart may look similar, but the story behind the move is different.
What happens if a stock in the index goes bankrupt
The index keeps going, because it's built from multiple constituents and rules, not one name. If a company fails, the index methodology adjusts through rebalancing or replacement, which is one reason indices spread company-specific risk across a basket. That's also why trading an index is not the same as being long a single stock, the structure absorbs some of the damage.
If you've practiced on demo and you understand how risk, stop distance, and point value fit together, take a closer look at MyFundedCapital. Its Instant Funding, 1-Step, and 2-Step Challenge paths are built for traders who want to apply disciplined index trading in a funded environment with clear loss limits and defined rules.
