You've probably seen this happen. Price pushes higher, looks strong, then one candle spikes up, reverses hard, and the next move takes out late buyers. If you've ever bought near the top of that move, the bearish pin bar is the candle you wish you had respected.
Most traders learn the shape first and the location second. That's backwards. The candle matters, but the edge comes primarily from where it forms and what it rejects.
What Is a Bearish Pin Bar and How Do You Spot It
A bearish pin bar is a single candle with a long upper wick and a small body near the low. It signals rejection of higher prices and a likely near-term move lower. Some trading guides define the wick as more than twice the body, while others use a stricter threshold of at least two-thirds of the full candle length, as explained in PriceAction's pin bar guide.
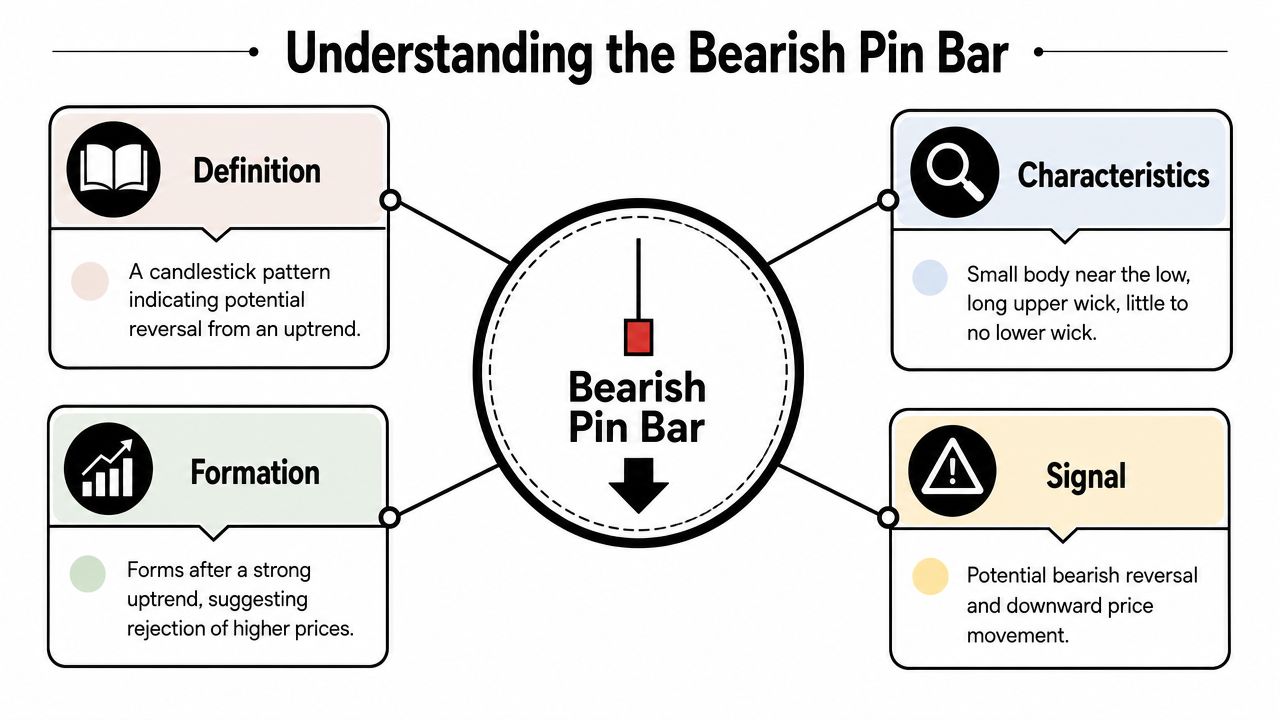
A lot of newer traders treat it like a visual pattern only. That's the mistake. The candle tells a story about a failed push higher. Buyers drove price up, but they couldn't keep it there. By the close, sellers had taken control and forced price back down near the session low.
Imagine a door buyers attempted to kick open. They managed to open it briefly, but sellers slammed it shut before the candle closed. The wick shows the failed attempt. The close near the low shows who won the fight.
The visual checklist
When you scan a chart, look for these features:
- Long upper wick: It should stand out clearly from nearby candles.
- Small real body: The body should sit near the lower part of the candle.
- Little or no lower wick: This isn't mandatory, but cleaner examples are easier to read.
- Close near the low: That close is what gives the pattern bearish intent.
- Clear location: The best examples form at resistance or after an uptrend, not in the middle of random chop.
Practical rule: If the candle shape looks decent but it forms in the middle of a messy range with no obvious level, skip it.
What traders often confuse
A bearish pin bar is closely related to the shooting star candlestick pattern. On many charts, traders use the terms almost interchangeably. What matters more than the label is whether the candle shows a real rejection from a meaningful price area.
Here's a simple way to separate a usable setup from chart clutter:
| Feature | Better setup | Weaker setup |
|---|---|---|
| Wick | Long and obvious | Barely larger than nearby candles |
| Body position | Near the low | Floating near the middle |
| Trend context | After an up move | In sideways chop |
| Location | At resistance | Mid-range with no structure |
The part that actually matters
The shape gets your attention. The context gives it meaning.
A textbook-looking bearish pin bar in the wrong place is often just noise. A slightly imperfect one at a major resistance level can be far more tradable. That's why experienced traders don't hunt candles first. They mark levels first, then wait to see if the market prints a rejection candle there.
The Market Psychology Behind a Bearish Pin Bar
A bearish pin bar compresses a whole intraday battle into one candle.
Early in the candle, buyers are in control. Price moves up, often through a recent high or into an area where breakout traders get interested. On the surface, it looks bullish. Anyone watching only momentum sees strength.
Then the move stalls.
Sellers step in at higher prices. Sometimes that happens at resistance. Sometimes it happens after a breakout fails. Sometimes larger participants decide that higher prices are attractive sell territory. However it starts, the result is the same. Price can't hold the highs.
What the wick is really showing
That long upper wick is the footprint of a failed bullish auction. Buyers pushed higher and didn't get acceptance. Sellers absorbed the move, then pushed price back down.
By the close, the candle finishes near its low. That close matters because it shows buyers didn't just lose momentum. They lost control.
The best bearish pin bars trap the traders who chased the break higher too late.
Those trapped buyers often become part of the next move down. If price breaks below the low of the pin bar, some exit their long positions while short sellers enter. That creates a cleaner downside push than the candle alone might suggest.
Why this pattern fools traders
The candle is deceptive because the most bullish part of it happens before it closes. Mid-candle, it can look like a breakout bar. Only after the session closes do you see the rejection.
That's why entering too early is one of the easiest ways to get punished. If you sell before the candle confirms, you're trading a theory, not a completed signal.
The emotional shift inside one candle
The sequence usually looks like this:
- Optimism: Buyers see continuation.
- Excitement: Price pushes into fresh highs or a key level.
- Failure: The breakout stalls and starts fading.
- Pressure: Sellers push price back through the body.
- Discomfort: Late buyers realize they may be trapped.
- Control flips: The candle closes near the low.
This is why the bearish pin bar can work so well in the right place. It doesn't just show rejection. It shows a failed attempt in one direction and a sharp transfer of control to the other side.
A Practical Rulebook for Trading the Bearish Pin Bar
Most losses with pin bars don't come from bad pattern recognition. They come from sloppy execution. If you're going to trade the bearish pin bar, you need fixed rules for entry, stop placement, and target selection.
For practical execution, stronger bearish pin bars tend to show up at predefined resistance, failed breakouts, or trendline rejections. A common execution method is to enter below the pin bar low and place the stop above the high, using the candle's full range as the risk unit. One strategy guide also notes at least 1:2 risk-reward for continuation-style setups, while another cites 1:3 in wedge-break scenarios, as outlined in Colibri Trader's pin bar strategies.
Entry methods that make sense
There are two common ways to enter:
- Break entry: Sell when price trades below the low of the bearish pin bar.
- Close-based entry: Enter shortly after the candle closes, if your plan allows more aggressive execution.
For most traders, the break entry is cleaner. It forces the market to prove that sellers still have control. If the candle closes bearish but price never breaks the low, the setup hasn't really triggered.
Stop-loss placement
Your stop belongs above the high of the pin bar. That's the invalidation point.
If price trades above that high after entry, the rejection failed. Don't widen the stop and call it “room.” The whole idea behind the trade is that the high should hold.
Execution note: A bearish pin bar without a defined invalidation point is not a setup. It's just a story.
Target selection
There are two practical ways to handle exits.
Fixed risk-reward
If your setup is part of a trend continuation or a clean rejection from resistance, projecting a fixed target can keep you disciplined.
- Minimum planning target: 1:2 risk-reward
- More selective structure-based target: 1:3 in the right conditions
These are planning tools, not promises. If the next support level sits too close and ruins the trade structure, pass on the setup.
Structure-based target
Use the next meaningful support area, prior swing low, or range boundary as your target zone. This approach respects the chart more than a fixed multiple does, especially in uneven price action.
A simple pre-trade checklist
Before taking a bearish pin bar, ask:
- Is it at a level I marked in advance?
- Did the candle close as a rejection?
- Am I entering below the low, not in the middle of the candle?
- Is the stop above the high still reasonable for my account risk?
- Does the chart leave room to target at least 1:2?
- Am I trading the setup, not forcing one?
If you want to build these entries into a broader discretionary framework, this price action trading strategy guide is a useful companion.
Good setup versus bad setup
| Element | Good bearish pin bar trade | Bad bearish pin bar trade |
|---|---|---|
| Location | Resistance, failed breakout, trendline rejection | Middle of a range |
| Entry | Below the low after confirmation | Early sell before close |
| Stop | Above the high | Arbitrary and too tight |
| Target | Support or at least 1:2 structure | No clear downside room |
| Decision | Planned and level-based | Impulsive because the candle “looks right” |
The pattern works best as an entry trigger, not as a complete strategy by itself.
Context Is King Spotting High-Probability Setups
Many pin bar articles fall short because they teach the candle shape as if the market rewards geometry. It doesn't. A bearish pin bar is usually worth trading only when it appears at a meaningful inflection point.
A lot of mainstream explanations admit this indirectly. They describe pin bars as most meaningful at key resistance, swing highs, or after an extended up move. This highlights the core lesson. The edge comes from market location, not the candle in isolation, as discussed in OneUp Trader's pin bar overview.

Where bearish pin bars deserve attention
The highest-quality setups usually show up in places where the market had a reason to react.
Horizontal resistance
This is the cleanest location. Price rallies into a prior swing high, supply zone, or well-tested resistance band and gets rejected. The pin bar tells you the level held for now.
Failed breakout
Price trades above a visible high, attracts breakout buyers, then closes back below the breakout area. That's often stronger than a random rejection because it traps participants on the wrong side.
Trendline or channel rejection
Trendlines aren't magic, but when price reaches a well-respected upper boundary and prints a bearish rejection candle, the setup becomes more coherent. The line gives structure. The pin bar gives timing.
What a bad setup looks like
A weak bearish pin bar often has one or more of these traits:
- Mid-range location: It forms in the center of a broad range.
- No prior level: There's nothing to reject except recent noise.
- Messy background: Nearby candles are erratic and directionless.
- Crowded downside: Support sits immediately underneath.
- Counter-impulse entry: You're trying to fade a strong market with no sign of exhaustion beyond one candle.
How to read good and bad annotated charts
When you mark charts for review, label them in plain language.
Good setup notes
- Resistance already marked before price arrived
- Wick sweeps above the level
- Candle closes back below resistance
- Next candles show bearish follow-through
- Clear room into support
Bad setup notes
- Candle shape is decent, but there's no level
- Price is still inside congestion
- Entry would sit directly above nearby support
- No real reason for sellers to defend that zone
If you use tools to organize market structure, a support and resistance indicator guide can help with level mapping. Just don't let any tool replace your own chart reading.
A mediocre-looking bearish pin bar at a major resistance zone is often better than a perfect-looking one in the middle of nowhere.
The professional mindset
The jump from beginner to competent trader usually happens when you stop asking, “Is this a pin bar?” and start asking, “Why here?”
That single shift cuts out a lot of bad trades. You stop reacting to candle shapes and start building setups around structure, liquidity, and rejection. That's what turns the bearish pin bar from a chart pattern into a usable decision tool.
Using Confirmation and Invalidation to Manage Your Trade
Entry is only the start. After the trade triggers, your job is to read whether the market is confirming your idea or proving it wrong.

A bearish pin bar gets stronger when the next candles behave the way they should. You want to see sellers follow through, not hesitate immediately.
Useful forms of confirmation
You don't need ten indicators. You need a few things that support the same bearish idea.
- Strong follow-through candle: A clean bearish candle after the pin bar shows that sellers are still active.
- Failure to reclaim the pin bar midpoint: If price retests part of the candle and gets rejected again, that's constructive.
- Rejection from a confluence zone: If the pin bar aligns with resistance, trendline rejection, or a prior swing high, the setup has more weight.
- Momentum disagreement: Some traders also look for bearish divergence on tools like RSI. That can support the reversal thesis, but it shouldn't override poor price structure.
Clear invalidation matters more than hope
A lot of traders manage this pattern badly because they keep “believing” in the setup after it's broken. Don't do that.
If price breaks above the high of the pin bar, your original rejection thesis is compromised. That was the level sellers were supposed to defend. If they can't hold it, the setup is no longer the same trade.
Here's a simple decision table:
| Post-entry behavior | What it suggests | Response |
|---|---|---|
| Price breaks the low and continues down | Setup is working | Hold to plan |
| Price stalls but stays below the high | Setup is still alive | Stay patient |
| Price reclaims most of the candle | Weakening signal | Tighten focus |
| Price breaks above the high | Invalidation | Exit decisively |
If the market trades through your invalidation point, capital preservation comes first. Analysis can wait.
Managing the trade without overmanaging it
Once price moves in your favor, don't suffocate the trade with constant adjustments. Manage it according to the plan you had before entry.
That usually means one of two approaches:
- Hold for the planned target if structure remains intact.
- Reduce exposure or trail risk only after price has clearly moved away from entry and confirmed downside control.
The key is consistency. Good trade management doesn't mean reacting to every candle. It means knowing what confirms your thesis, what weakens it, and what invalidates it completely.
Common Pitfalls When Trading Pin Bars and How to Avoid Them
Most bearish pin bar losses are avoidable. Traders usually don't fail because the pattern is flawed. They fail because they force it where it doesn't belong.
The mistakes that keep showing up
- Trading the shape without the level: Don't short every long upper wick. Trade pin bars that reject a meaningful area. Skip the random ones.
- Entering before the candle closes: A candle can look like a perfect rejection bar and finish as something completely different. Wait for the close.
- Ignoring candle size: A huge pin bar can create a stop that's too wide for the available reward. If the structure doesn't support the risk, pass.
- Fading strong trend conditions blindly: A single bearish candle against aggressive upside momentum often isn't enough. You need stronger context.
- Using low-timeframe noise as if it were structure: Lower charts can print many pin bars that mean very little on their own.
What to do instead
Use a simple filter:
- Mark resistance first.
- Wait for price to test it.
- Let the candle close.
- Check whether the trade still offers acceptable risk relative to nearby support.
- Enter only if the market confirms below the low.
That sequence feels slower, but that's the point. Good bearish pin bar trades usually come from patience, not from speed.
Frequently Asked Questions
How reliable is the bearish pin bar on different timeframes
It's generally more reliable on higher timeframes such as the 4-hour, daily, and weekly charts. On those charts, each candle reflects a larger battle between buyers and sellers. On very low timeframes, bearish pin bars appear more often and many of them are just noise. If you trade lower charts, context and follow-through matter even more.
Can I use this pattern for crypto or stock trading
Yes. The pattern reflects price rejection, so it can appear in forex, stocks, crypto, indices, and commodities. What changes is the volatility and the way you size the trade. A bearish pin bar on a fast-moving instrument may require a wider stop, which means smaller position size if you want to keep your risk controlled.
What if the pin bar body is bullish instead of bearish
It can still matter. A candle with a long upper wick and a close below the highs still shows rejection. Many traders see that as a weaker bearish signal than a candle that closes near the low with a bearish body, so they often want stronger confirmation before entering.
Should I trade a bearish pin bar by itself
Usually not. The better approach is to treat it as a trigger inside a broader setup. If it appears at resistance, after an extended push up, or as part of a failed breakout, it has a clear job. If it appears without context, it's often just a dramatic-looking candle.
If you want to apply these ideas in a more structured environment, MyFundedCapital gives traders a way to prove discipline through simulated funding programs. You can compare challenge models, review the risk parameters, and choose the path that fits your style. Trading always involves risk of loss, and this article is educational only, not financial advice. If you're ready to test your process under real rules, start by exploring the available funding programs and account types.