You've probably done this already. You find a stock setup that looks clean on a chart, scroll back, mark a few winning trades, and start thinking you've found something real.
Then live trading starts, fills come in worse than expected, the losers cluster, and the “edge” disappears. Back testing stocks is supposed to prevent that. If you do it properly, it won't give you certainty, but it will tell you whether your idea deserves more of your time.
The Foundations of Reliable Stock Backtesting
A flimsy backtest is easy to spot. The rules are vague, the data is incomplete, and the result looks better than any live trader ever gets.
A reliable backtest starts with two things only. Clean data and a simulation engine you trust. If either one is weak, the strategy result is noise dressed up as research.
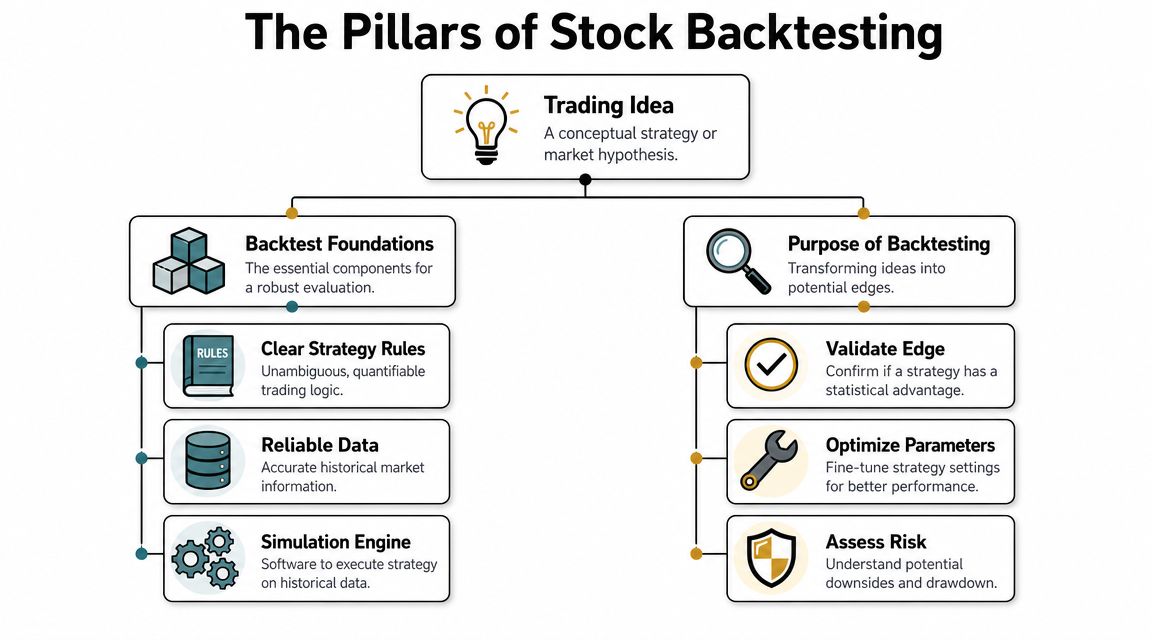
Start with rules that a machine can follow
If your rule says “buy strong stocks on good momentum,” you don't have a strategy. You have an opinion. A backtest needs instructions that produce the same answer every time.
Write down:
- Entry logic. Exact trigger, exact time, exact condition.
- Exit logic. Profit target, stop, time exit, trailing rule, or signal reversal.
- Position sizing. Fixed shares, fixed dollar risk, or volatility-based sizing.
- Universe selection. Which stocks qualify and when.
- Trade filter. Market regime, liquidity screen, sector screen, or trend condition.
Practical rule: If two traders can read your rules and place different trades, the strategy isn't ready for testing.
The same applies to timeframes. Daily close systems are simpler to test than intraday systems because they usually involve fewer assumptions about fill quality. Intraday stock systems can work, but they punish sloppy research fast.
Your data must reflect what actually happened
A lot of back testing stocks fails before the first trade is simulated because the data isn't complete. Stocks split. They pay dividends. Companies get acquired. Some disappear entirely. If the dataset misses corporate actions or only keeps today's survivors, the result gets distorted.
At a minimum, check that your data handles:
- Splits and dividends so historical prices are comparable
- Corporate actions that affect returns and symbol continuity
- Delisted names if your universe includes broad equities
- Point-in-time membership if you're screening from an index or watchlist
- Missing bars or bad ticks that can fake entries and exits
If you're still sorting out the basics, this primer on what backtesting is and how traders use it is a good baseline before you start coding or buying data.
Choose the engine based on your strategy, not your ego
You don't need to build everything from scratch. Sometimes Python is the right tool. Sometimes a platform is enough.
| Option | Best for | Strength | Limitation |
|---|---|---|---|
| Python with custom code | Complex logic, portfolio tests, custom data handling | Maximum flexibility | More setup, more room for coding mistakes |
| TradingView-style visual tools | Fast idea checks and chart-based rules | Speed and convenience | Limited control over deeper execution details |
| Dedicated backtesting software | Structured strategy testing | Faster workflow | Depends on platform constraints |
Use the simplest tool that can model your actual rules. Not a simpler version of them.
For structure, treat your test like staged research, not a one-shot verdict. One guide on backtesting trading strategies recommends at least 30 trades for a basic sanity check, 100 trades for minimum statistical reliability, and 200+ trades for meaningful performance analysis, along with 3–5 years of data and a 60/20/20 development, testing, and validation split. That's a good standard because it forces the strategy to face more than one type of market.
Trading involves risk of loss. A clean-looking chart doesn't reduce that risk. A disciplined research process does a better job, but even then, a backtest is still a historical simulation, not proof.
Building Your Signal and Simulation Engine
At this stage, most traders either become systematic or stay stuck in “looks good to me” mode.
A stock strategy has to move from chart idea to executable logic. Every part of the trade needs to be explicit, including the ugly part most retail traders skip, which is cost.
Turn the idea into instructions
Take a plain setup like a trend signal. Don't leave it at “buy the breakout.” Define it in a way your platform can test without interpretation.
For example, your logic might specify:
- Universe. U.S. stocks above a liquidity threshold.
- Setup. Price above a long-term moving average.
- Trigger. Enter when today's close exceeds a prior reference level.
- Risk rule. Exit if price hits a predefined stop condition.
- Profit rule. Exit on a target, trailing stop, or time-based rule.
- Sizing rule. Risk a fixed fraction of capital or use fixed nominal size.
The important part isn't the specific indicator. It's whether the rule is unambiguous and repeatable.
Build execution assumptions into the engine
In this context, paper edges die. Your strategy might identify a real pattern, but if your simulation assumes perfect fills, the result is inflated from day one.
A practical backtest should model:
- Commissions
- Bid-ask spread
- Slippage
- Execution delay
- Position size effects in less liquid names
One trading guide puts the right question directly: how much slippage, commission, and execution delay will erase your edge. That's the question that matters because many retail traders still look at gross returns, while short-horizon stock setups can fail when only a few basis points move against them.
The first version of a strategy should be harder on itself than the market will be. If it only works with perfect fills, it doesn't work.
What works and what usually doesn't
A simple signal with realistic assumptions often beats a complex one with fantasy execution. That's not theory. It's just how trading behaves in production.
Use this checklist when building your simulation:
- Use bar timing accurately. If you generate a signal from the close, don't assume you bought earlier in the same bar.
- Model costs on every trade. Don't add them later as an afterthought.
- Keep parameters sparse. More knobs usually means more ways to fool yourself.
- Test position sizing separately. A decent entry can become fragile under bad sizing logic.
- Log every assumption. If the strategy changes, you want an audit trail.
If you're deciding between platforms, compare your options with a guide to back test software for active traders. Focus on whether the tool can handle your universe, your time horizon, and your cost model.
Your tooling matters more than most traders think
A surprising amount of trading research fails for software reasons, not market reasons. Traders rush prototypes, mix logic versions, or run tests they can't reproduce later.
That's why good development practice matters here too. Teams outside trading think about version control, test coverage, and reproducibility for a reason. If you want a useful parallel, this piece on Accelerating software delivery with AI is worth reading. The lesson for traders is simple. Faster iteration only helps if the process stays controlled and verifiable.
If your engine can't tell you exactly why a trade happened, what assumptions were applied, and where costs hit the result, keep building.
Sidestepping the Hidden Traps and Biases
Some backtests lie loudly. Most lie subtly.
They lie by excluding dead stocks, by letting future data leak into the signal, or by rewarding the trader for tweaking parameters until the equity curve looks smooth. If you don't police those mistakes, the strategy you approve in research will behave like a stranger in live trading.
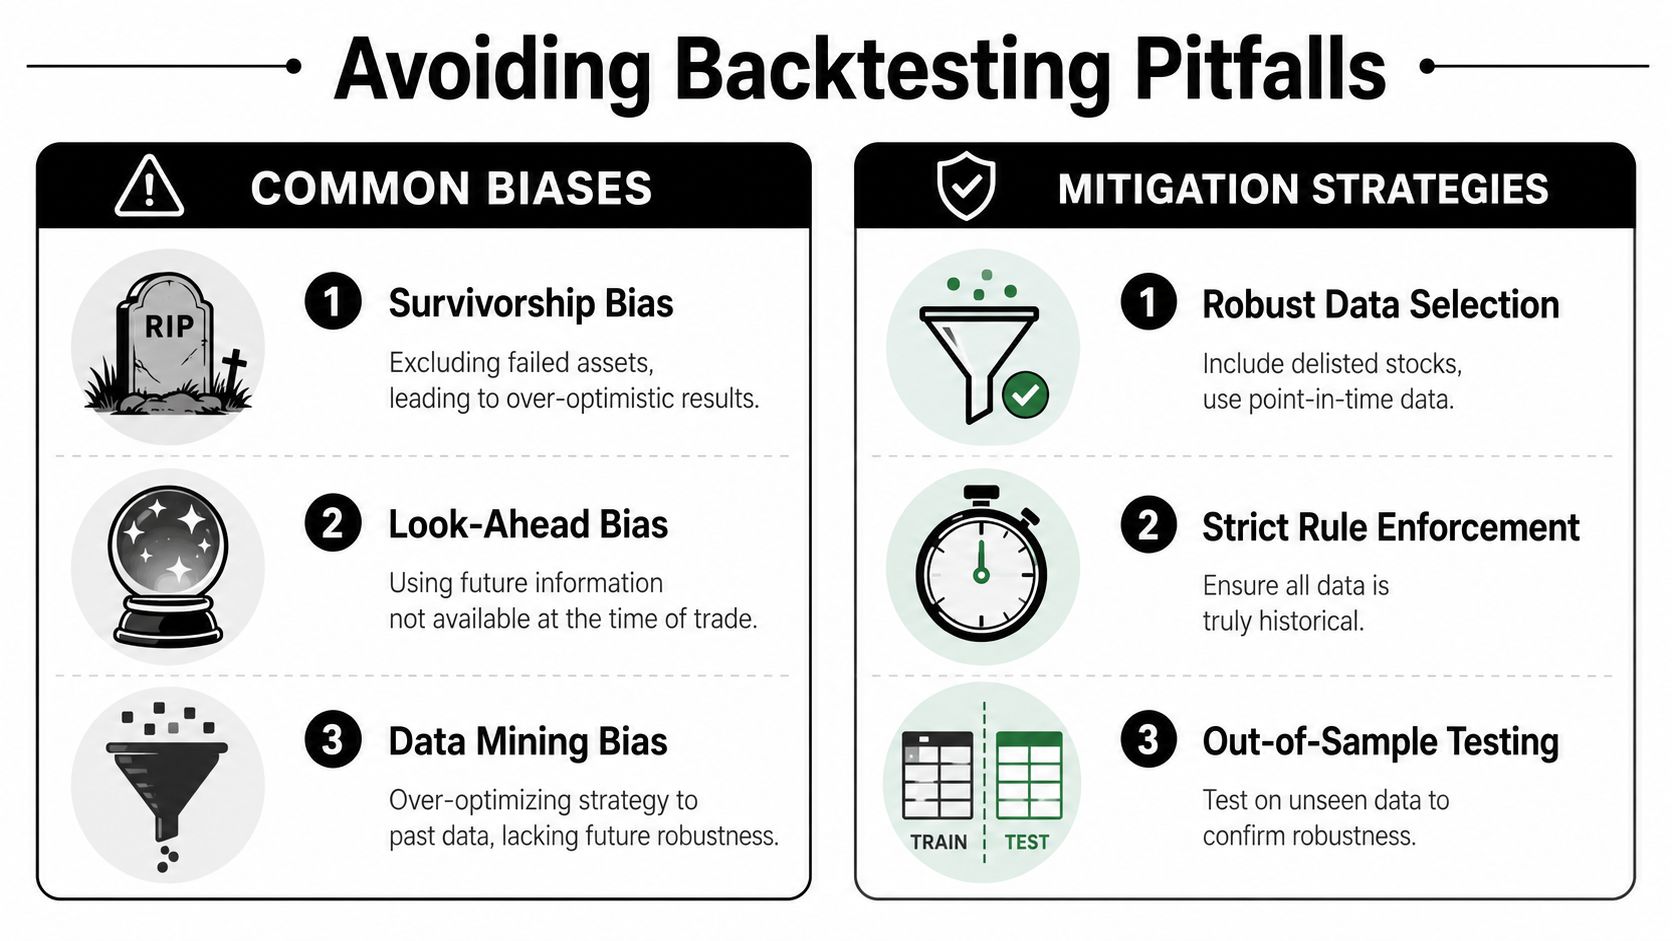
Survivorship bias
This one catches a lot of stock traders because the damage is hidden inside the dataset. If your historical universe only includes companies that still exist, you've removed many of the names that failed, delisted, or got acquired.
That inflates the result. A discussion of backtesting pitfalls notes that many amateur datasets only include stocks that still exist today, which can inflate performance by excluding bankrupt or acquired firms. This matters even more in small caps, where turnover in the universe is constant.
A quick audit helps:
- Check delisted coverage before you trust any equity curve
- Verify historical universe membership if your scan uses an index or exchange subset
- Review symbol changes and mergers so the strategy doesn't skip broken histories
If your fills are already under pressure in live trading, understanding what slippage means in practical trading terms helps connect research bias to execution reality.
Look-ahead bias
This is less obvious and just as destructive. The system uses information that wasn't available at the time of the trade.
Common examples:
| Bad test behavior | Why it breaks the result |
|---|---|
| Buying at the open based on the same day's closing condition | You used future information |
| Ranking stocks with revised data not known at the time | The model sees a cleaner world than traders did |
| Entering on a bar using indicators calculated from the full completed bar before execution | The strategy acts after the fact |
This usually happens when traders move too fast in spreadsheets or platform scripts. They align columns incorrectly, assume all data fields are known instantly, or forget that signal time and execution time are separate events.
If your strategy can only trade after seeing the completed bar, then the fill has to happen after the completed bar too.
Overfitting
Overfitting is the most seductive trap because it feels like research. You change one parameter. Then another. Then a filter. Then a market cap threshold. Then a volatility cutoff. The equity curve improves every time.
What happened is simpler. You trained the strategy to memorize history.
Use a bias checklist before you trust any result:
- Freeze the rules early so you don't keep redesigning the idea after seeing outcomes
- Track every parameter change and every rejected variant
- Keep the model simple unless complexity is unavoidable
- Validate on unseen data instead of recycling the same sample
- Look for broad usefulness across different regimes, not perfection in one slice
A strategy that only works on one historical path is usually a curve fit. A strategy that survives messy conditions is far more interesting.
Trading is risky, and bias makes that risk harder to see. That's why disciplined traders spend as much time attacking their own test as they do building it.
Interpreting Results and Stress-Testing for Confidence
A finished backtest usually dumps out a page full of metrics. Most traders scan straight to net profit, maybe win rate, then stop.
That's not enough. You're not judging whether the strategy had some good trades. You're judging whether it has a repeatable edge that still looks acceptable after you account for risk, variation, and the fact that you probably tested more than one idea.
Read the metrics like a risk manager
Net profit matters, but only in context. A strategy that makes money while exposing you to brutal drawdowns or unstable trade distribution may still be unusable.
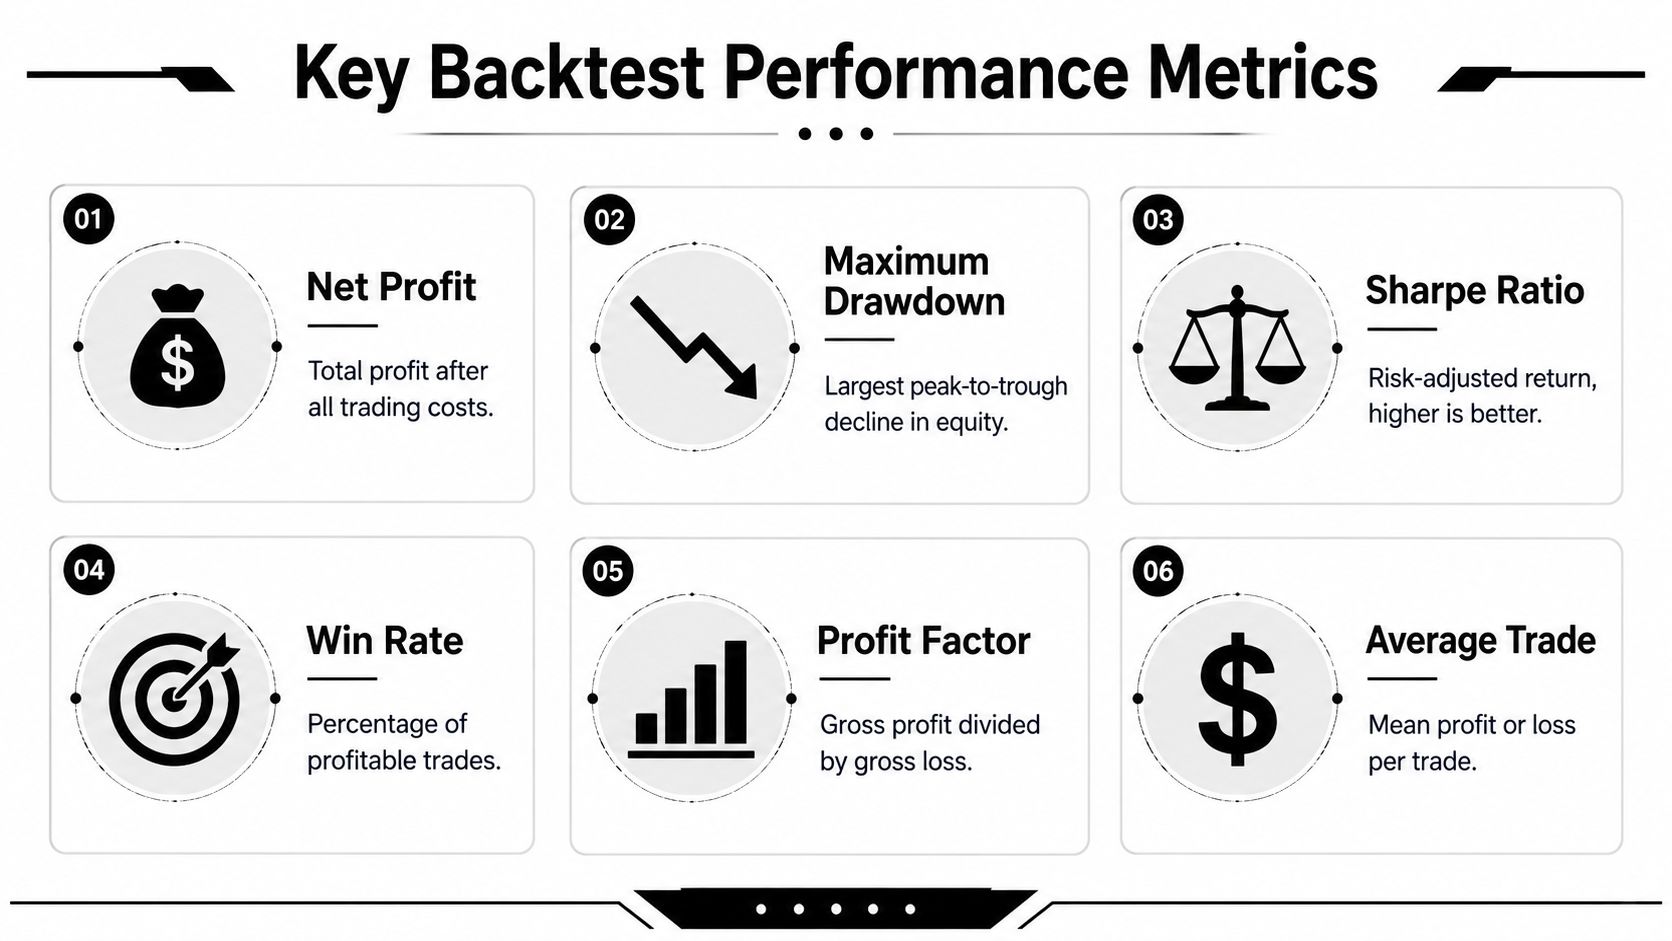
Focus on a small group of metrics first:
- Net profit shows what remained after costs
- Maximum drawdown shows the worst peak-to-trough hit
- Sharpe ratio gives a risk-adjusted return view
- Win rate tells you how often the strategy is right, but not how much it makes when right
- Profit factor helps compare gross profit to gross loss
- Average trade shows whether the edge per trade is meaningful after friction
A useful shortcut is to ask three questions. How bad can the losing stretch get? Is the average trade still worth taking after realistic costs? Would you keep trading this through the drawdown profile shown by the test?
Don't trust raw performance at face value
Backtests often look strongest right after the trader has tried many variations. That creates a statistical problem. The more versions you test, the more likely one of them looks special by chance.
A CME Group paper on backtesting shows why professional traders apply a correction rather than taking raw metrics at face value. In the paper's example, when multiple testing is accounted for across ten trials, a p-value can rise to 0.029, and the Sharpe-ratio haircut can be about 27%. The same paper notes that the haircut is often above 50% when the annualized Sharpe ratio is below 0.4, while a Sharpe ratio above 1.0 faces a haircut of at most 25% in that framework. You can review that discussion in CME Group's paper on backtesting and Sharpe-ratio haircuts.
That's a hard lesson, but a useful one. A nice Sharpe in isolation doesn't mean much if you found it after a long parameter hunt.
Desk standard: The more strategy variants you test, the less impressed you should be by any single result.
Stress-test before you trust
A decent backtest survives more than one presentation of the data.
Use stress checks such as:
- Out-of-sample validation. Hold back data the strategy never sees during development.
- Walk-forward testing. Refit or recalibrate on one segment, then test on the next unseen segment.
- Regime review. Check behavior in bull, bear, sideways, high-volatility, and low-volatility periods.
- Cost sensitivity. Increase slippage and commissions to see when the edge disappears.
- Execution timing sensitivity. Delay the fill logic and inspect how much performance degrades.
Software engineers use stress tests to understand how systems behave under strain, not under ideal conditions. The same mindset applies here. If you want a general parallel, this article on building resilient systems captures the logic well. Resilience is more valuable than a pretty baseline result.
What a trustworthy result usually looks like
It rarely looks perfect. It looks durable.
You'll usually see:
- A moderate but persistent edge, not a miracle curve
- Acceptable drawdowns, not smooth sailing
- Performance that weakens under tougher assumptions but doesn't collapse
- Results that still make sense after the strategy is tested on unseen data
Past performance is not a guarantee of future results. But if your strategy survives cost pressure, statistical skepticism, and regime variation, you've moved a lot closer to something tradable.
Frequently Asked Questions About Backtesting Stocks
A few practical questions come up every time traders move from theory to actual testing. Here are the direct answers.
| Question | Answer |
|---|---|
| How many trades do I need before I should take a backtest seriously? | Treat a small sample as a screening tool, not a decision tool. One industry guide recommends at least 30 trades for a basic sanity check, 200+ trades for detailed performance analysis, and 3–5 years of historical data across multiple market cycles, along with out-of-sample testing using a 60%/20%/20% split in a staged process described by QuantInsti's article on backtesting trading strategies. |
| Should I backtest manually or automate it? | Manual backtesting can help you learn a setup and catch obvious rule flaws. It's useful early. Automated testing becomes more important once the strategy has fixed rules and you need consistency, larger samples, and cleaner execution logic. If your rules still depend on visual interpretation, fix that first. |
| What's the biggest mistake beginners make when back testing stocks? | They test gross returns and ignore what live trading will charge them for being wrong by a small amount. A strategy can look excellent in historical simulation and still fail when spreads, slippage, and commissions show up. Beginners also tend to keep changing parameters until the past looks cleaner than the future ever will. |
| When is a strategy ready for forward testing instead of more backtesting? | Move to forward testing when the rules are stable, the assumptions are documented, and the edge still holds after unseen-data validation and tougher cost settings. If you're still changing entries every week, you're not validating. You're still inventing. |
Two more points matter here.
First, backtesting is educational, not predictive certainty. It helps you reject weak ideas quickly and refine stronger ones, but it doesn't remove risk.
Second, live trading adds pressure that research can't fully simulate. Even strong systems face missed trades, hesitation, and execution noise. That's why paper trading or simulated forward testing sits between research and real capital.
Is Your Strategy Ready for Live Trading
A strategy earns the right to go live. It doesn't get that right because the chart looks clean or because a spreadsheet says the returns were attractive.
It gets that right after it survives scrutiny. The rules are clear. The data is honest. The engine reflects actual trading. The test includes cost pressure, unseen data, and enough variation to expose weak spots.
Signs the strategy may be ready
You're in a reasonable position to move forward when these statements are true:
- The rules are fixed and you're no longer redesigning the setup after every result
- The backtest includes realistic frictions instead of fantasy execution
- The sample is broad enough to show more than one market type
- The out-of-sample result still supports the idea
- The drawdown profile is something you could trade
This doesn't mean the strategy will print money live. It means it has passed the minimum standard for serious consideration.
Signs it probably isn't ready
Be honest if any of these are still true:
- You only trust the best parameter set
- The edge disappears when costs rise
- The strategy only works in one period or one stock cluster
- You can't explain why the setup should work
- You wouldn't be able to follow it through a losing run
One trading resource on common backtesting mistakes makes the central point well. The most common failure is underestimating execution friction. Ignore commissions, spreads, and slippage, and a paper profit can become a live-loss strategy. That's why resilient strategies need to hold up across different market regimes, not just one historical path.
A strategy that survives realistic assumptions is usually less exciting on paper and more useful in real trading.
The practical next step
Once a strategy clears your research process, don't jump straight to size. Forward test it. Trade it small. Compare live behavior to your backtest assumptions. Watch where slippage shows up, where fills differ, and whether you can execute the system the way the model expects.
Trading involves substantial risk of loss, and this article is educational only, not financial advice. Still, disciplined back testing stocks gives you something most traders never build. A quantified process you can inspect, improve, and decide whether to scale.
If you've built a strategy that can survive realistic costs, bias checks, and hard validation, the next step is proving it in a structured environment. MyFundedCapital gives traders a way to do that through funding programs built around clear risk rules, multiple account paths, and support for discretionary and systematic styles. If you're ready to move from research to execution, compare the available account types and start a challenge that fits your process.