

 AR
AR
 NL
NL
 EN
EN
 FR
FR
 DE
DE
 IT
IT
 PL
PL
 SV
SV
 PT
PT

Most retail trading bots underperform in live conditions, and a 2025 analysis of 2,800 retail algorithmic accounts found that 73% underperformed the S&P 500 buy-and-hold benchmark over 12 months (InsigTrade's 2026 evidence summary). Trading bots can be profitable, but this article quantifies why attractive backtests often decay in execution and which strategy designs have the best chance of preserving an edge.
What the Evidence Actually Shows About Trading Bot Profits
The direct answer to are trading bots profitable is yes, but not in the way most sales pages imply. Automated trading has produced real profits in documented markets, yet those profits are unevenly distributed and usually depend on execution quality, transaction costs, strategy design, and market structure.
Research on the E-mini S&P 500 futures market found that 31 high-frequency trading firms earned more than $29 million in trading profits in a single month, with an average Sharpe ratio of 9.2 (Brogaard's HFT research). That result establishes that automated systems can make money. It doesn't establish that a retail bot using ordinary data, broker execution, and limited capital can reproduce it.
A broader benchmark estimated about $2.8 billion in gross annual HFT profits, but only roughly 0.75 basis points per $100 traded, before expenses, with a pre-expense annualized Sharpe ratio of 4.5 (Brogaard's NBER paper). The lesson is uncomfortable but useful: a bot may have an edge while still losing money after commissions, spread, slippage, and infrastructure costs.
The retail baseline
Recent evidence is more relevant to an individual trader than institutional HFT statistics. The 2025 account analysis cited above found that 73% of retail algorithmic accounts lagged S&P 500 buy-and-hold over 12 months. Independent commentary also concludes that most retail bots aren't consistently profitable in live conditions, while noting that no official census measures bot failure rates (TradeWink's review of trading-bot profitability).
| Metric | Typical Backtest Result | Typical Live Result |
|---|---|---|
| Gross return | Attractive before execution costs | Lower after fees and slippage |
| Drawdown | Often optimized around historical data | Can widen during new regimes |
| Trade quality | Assumes ideal fills | Depends on spread, latency, and liquidity |
| Benchmark result | May look profitable in isolation | Often fails to beat a simple benchmark |
The practical test isn't whether a bot shows a positive backtest. It's whether the strategy produces net returns after realistic costs, survives an unseen market regime, and remains competitive with a relevant passive or discretionary alternative. A useful overview of the broader question is how algorithmic trading works in practice, but any bot still needs independent validation.
How a Trading Bot Actually Works in Practice
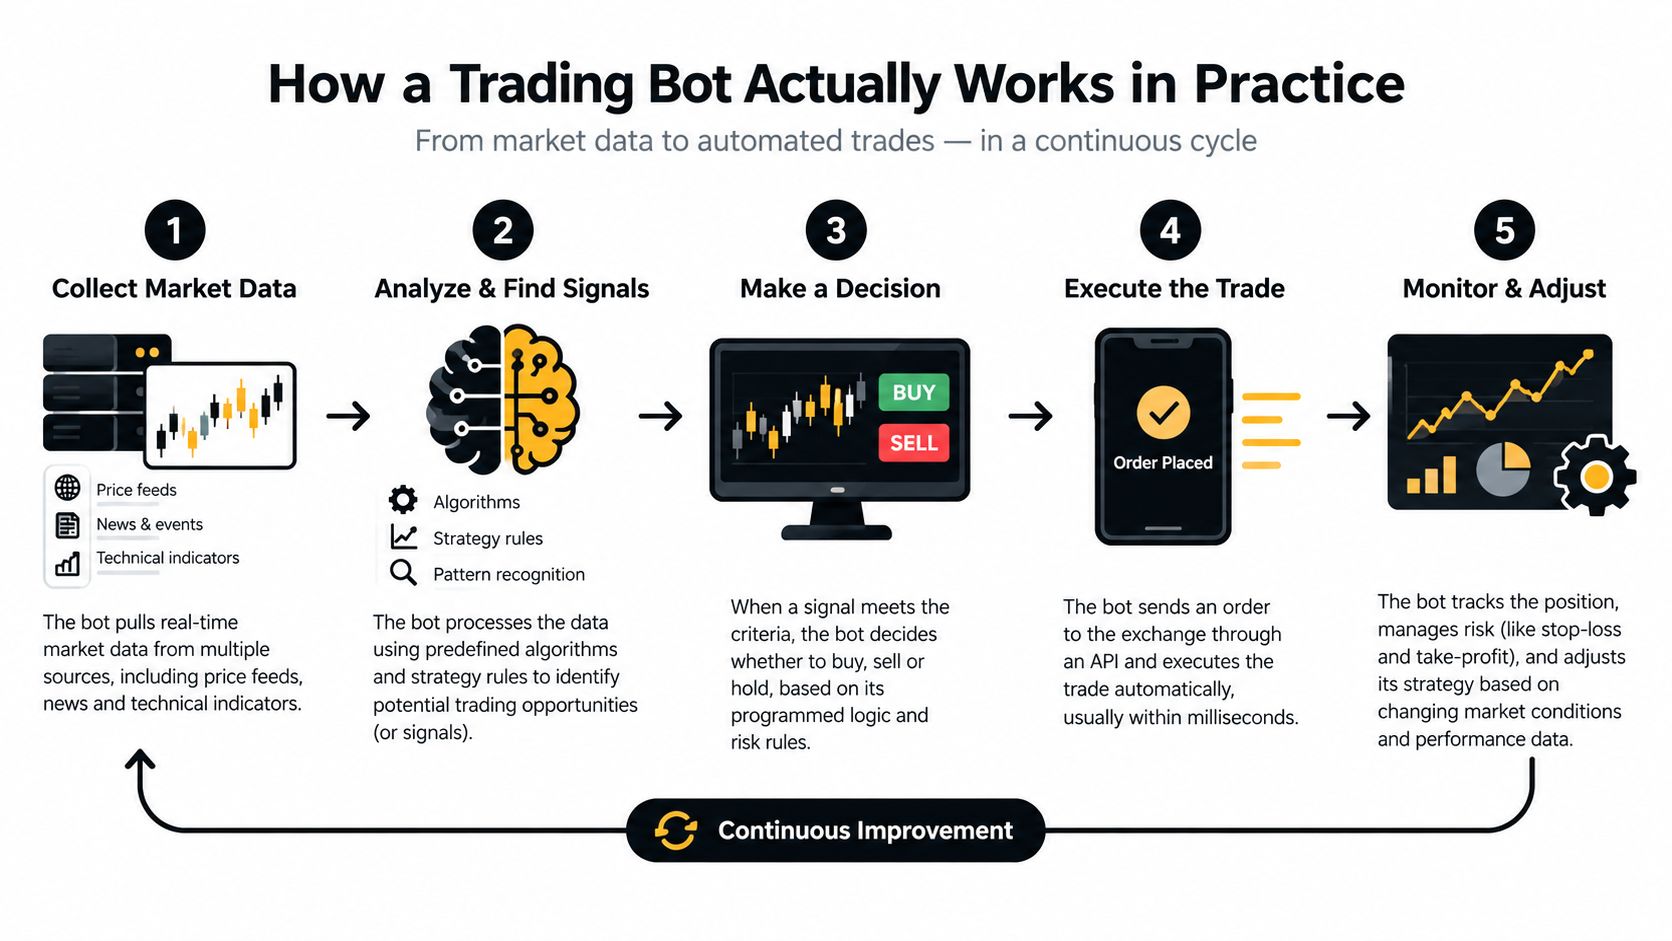
A trading bot is an automated chain, not a magic predictor. It receives data, applies rules, sends orders, and manages open positions. If one link fails, the final result can differ sharply from the backtest.
From market data to a position
Data ingestion: The system reads prices, volume, candle data, or order-book information through a market data feed. Poor timestamps, missing candles, or delayed data can create signals that weren't available at the time of execution.
Signal generation: An indicator library or custom model transforms data into a rule. A beginner example is a 20/50 EMA crossover on EURUSD. When the faster exponential moving average crosses above the slower one, the bot may create a long signal.
Order placement: The bot connects to a broker through a REST API or FIX interface and chooses an order type. A market order prioritizes execution, while a limit order prioritizes price and may not fill.
Position management: Stop-losses, take-profits, trailing exits, and position-sizing rules determine what happens after entry. A strategy isn't complete until it defines how it exits.
Monitoring and recovery: The operator needs logs, alerts, and a kill switch for API errors, rejected orders, disconnected feeds, and abnormal fills.
The bot is the executor. The edge lives in the rule set and its relationship with the market. The same EMA rule can produce different P&L when one setup pays wider spread, experiences slower latency, or trades during thinner liquidity.
Practical rule: If you can't explain why the bot entered, how much the trade cost, and what condition forces it to stop, you aren't operating a tested strategy. You're outsourcing decisions to a black box.
A structured explanation of how to trade with algorithms can help clarify the workflow, but automation doesn't remove the operator's responsibility. Data quality, broker connectivity, order handling, and risk limits all matter before strategy sophistication enters the discussion.
Common Bot Strategies and Their Profitability Profiles
Different bot families pursue different sources of edge. Treating them as one category leads traders to apply a range-bound system in a trend, or a latency-sensitive system through a retail API.
Strategy comparison
| Strategy Family | Edge Durability | Latency Sensitivity | Retail Accessibility |
|---|---|---|---|
| Trend following | Can persist across long periods, but drawdowns can be deep | Low to moderate | Relatively accessible |
| Mean reversion | Useful in stable ranges, vulnerable to regime shifts | Moderate | Accessible on liquid markets |
| Statistical arbitrage | Depends on stable relationships and costs | High | Limited |
| Market making | Requires spread capture and inventory control | Very high | Difficult |
| High-frequency trading | Documented institutional profitability, highly competitive | Extreme | Generally inaccessible |
Trend-following and momentum systems offer the clearest practical route for many retail traders because they don't require millisecond execution. Their weakness is prolonged drawdown when markets move sideways or reverse sharply. A trend bot must tolerate losing trades and avoid excessive parameter changes after a quiet period.
Mean reversion can work when prices oscillate inside a stable range. It becomes dangerous when a persistent trend turns small entries into a growing inventory problem. The system needs a volatility filter, exposure cap, and explicit shutdown condition rather than an assumption that price must return to its average.
Statistical arbitrage looks attractive because it targets relative mispricing instead of direction. In practice, the relationship can break, and execution costs can consume the spread. Market making adds inventory risk and requires reliable order-book handling, queue awareness, and fast cancellation.
HFT is the clearest example of profitable automation that doesn't translate well to retail. The HFT evidence cited earlier shows real institutional profits, but those systems compete through infrastructure, data, speed, and scale that most individuals don't possess.
For most retail traders, a slower trend bot or session-based mean-reversion system on liquid instruments offers a more realistic risk-adjusted starting point. Arbitrage and HFT should usually be ruled out before development begins, not after capital has been lost.
The Backtest to Live Gap That Erases Most Edges
A bot can lose 40% to 60% of its simulated return after deployment in some settings (InsigTrade's analysis). That gap explains why a profitable equity curve often fails to produce equivalent cash results.
Backtesting asks what fixed rules would have earned from historical prices. Live trading asks what the account received after orders met the market. The difference comes from several costs:
- Commissions: Each completed trade reduces gross profit and loss.
- Spread: Entries and exits occur across different bid and ask prices.
- Slippage: The fill may be worse than the modeled price.
- Latency: Prices can move between signal generation and order placement.
- Market impact: Larger orders can consume available liquidity and move price.
A practical crypto backtesting guide recommends at least 12 months of OHLCV data across multiple regimes, with fees of about 0.1% per side and slippage around 0.1% to 0.2% per trade (Cryptohopper's backtesting guide). These assumptions do not make a test realistic by themselves. Leaving them out makes inflated performance far more likely.
Why the equity curve misleads
Look-ahead bias gives a model information that would not have existed at trade time. Survivorship bias removes instruments or strategies that failed. Regime change then tests whether the rules can withstand shifts in volatility, correlation, liquidity, and participant behavior.
A 2026 systematic review found no general AI or trading-bot architecture with persistent, cross-regime, capacity-aware net alpha after costs and constraints were included (systematic review of automated investing). The size of live decay varies by market and strategy, but the conclusion is consistent: paper returns are not cash returns.
| Component | Drag Per Trade | Annual Impact |
|---|---|---|
| Commission | Broker or exchange charge | Reduces every completed position |
| Spread | Bid-ask difference | Creates immediate entry and exit friction |
| Slippage | Worse-than-modeled fill | Increases in fast or thin markets |
| Latency | Signal-to-order delay | Can turn a valid signal into a poor fill |
| Market impact | Price movement caused by size | Expands as position size grows |
The strongest retail control is cost discipline. Lower turnover, liquid instruments, sensible order types, and realistic fills often matter more than another indicator.
Review what backtesting involves before trusting a result, then rerun the test with costs, delayed execution, rejected orders, and out-of-sample data. Strategy families that trade less frequently and remain liquid have a better chance of preserving an edge, although no backtest proves live profitability.
Metrics That Separate a Real Edge From Lucky Backtests
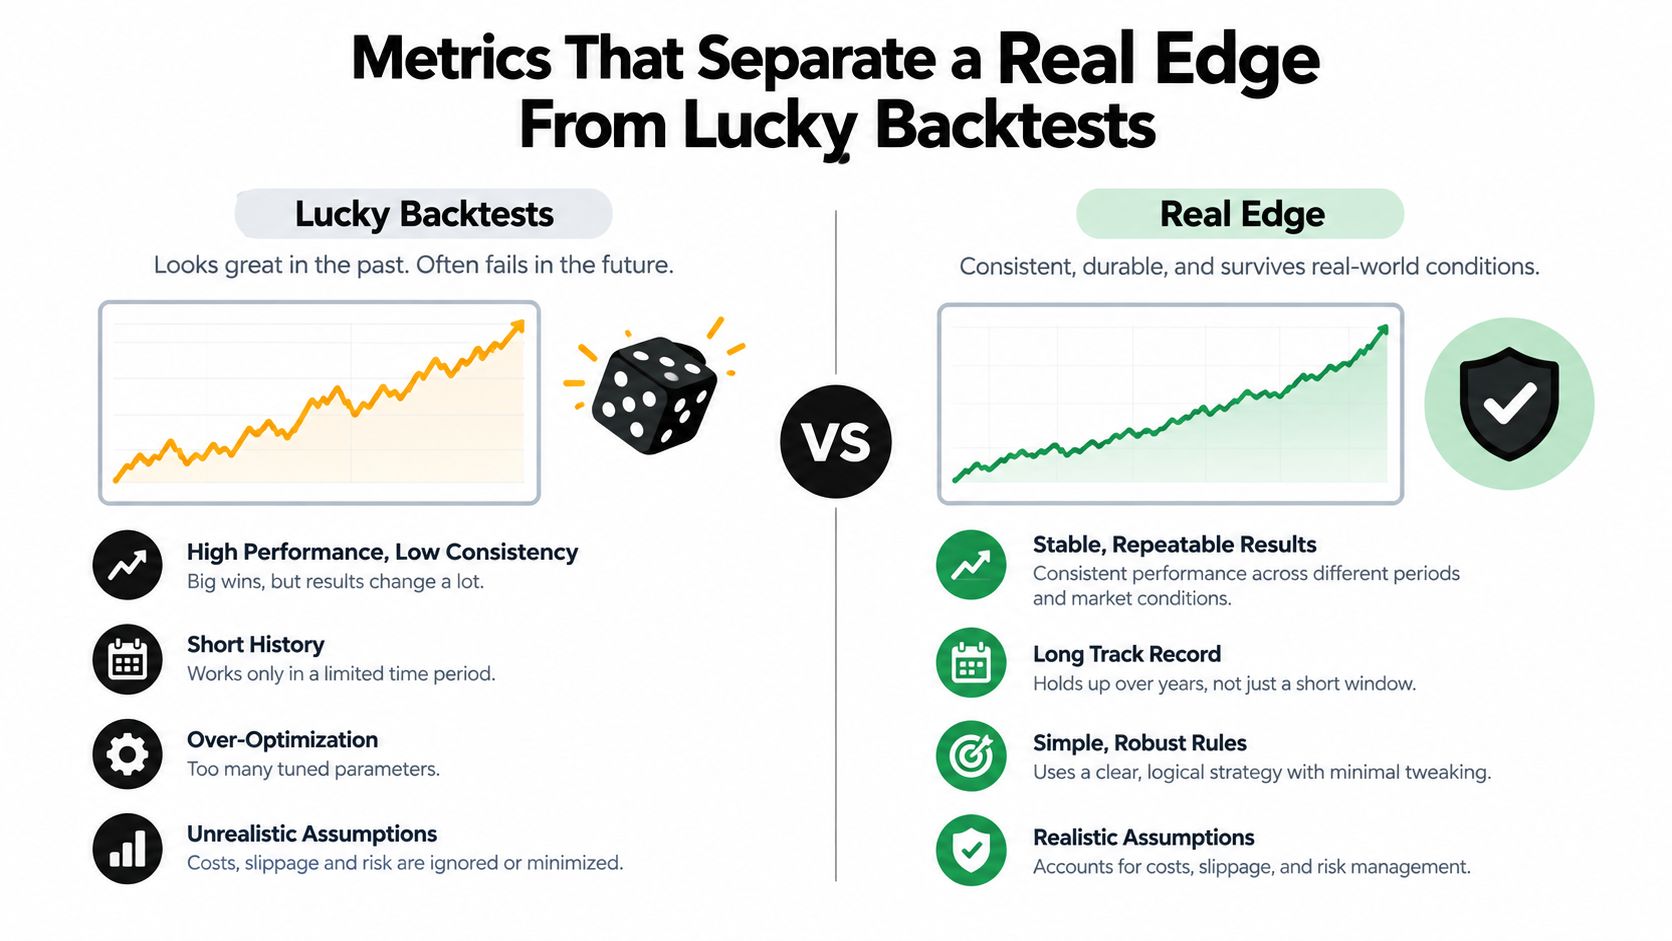
Headline return is the least reliable number on a bot dashboard. A strategy can show a strong gain while carrying unacceptable drawdown, relying on too few trades, or benefiting from one unusual historical period.
Five metrics worth checking
Sharpe ratio: Use it as a risk-adjusted return measure, not a promise. A retail bot with a Sharpe below 1.0 deserves skepticism, while 1.5 or higher is more credible only when it survives unseen data and costs.
Profit factor: Divide gross profit by gross loss. A result above 1.3 after costs gives the strategy more room for live deterioration than a barely positive result.
Maximum drawdown: Compare the deepest historical decline with the account's actual loss tolerance. A bot that needs a drawdown larger than the account can withstand isn't viable, even if its final return is positive.
Win rate and payoff ratio: Win rate alone misleads. A system winning 35% of trades with a 3:1 reward-to-risk profile can outperform a high-win-rate scalper if the scalper's small gains disappear into spread and fees.
Expectancy per trade: Calculate average profit per trade after costs. Expressing expectancy in dollars makes the result operational because it connects the edge to position size, fees, and account limits.
Validation comes before interpretation
Run out-of-sample tests and walk-forward analysis before trusting any metric. A high Sharpe ratio from a parameter set optimized on the same data isn't evidence of consistency. It may only show that the model learned the sample.
A bot that publishes return without drawdown, trade count, costs, and out-of-sample results is presenting marketing, not proof.
Two Real-World Case Studies From the Research
The research record contains both profitable automation and unstable, tiny edges. The contrast matters more than either example alone.
A published chapter on EA bot trading reported an average monthly return of 8.7% for the bot versus 3.4% for manual trading, alongside a profit factor of 2.35 and lower drawdown (the published EA trading chapter. That result supports a narrow conclusion. Some automated systems can outperform manual trading when their rules and risk controls are disciplined. It doesn't prove that the result persists across instruments, regimes, or live execution.
A separate science-fair comparison found a bot's average ROI at +0.0092%, while the human trader group recorded an average loss of -0.00111111111% (the bot and human comparison). The difference is positive but extremely small, and a short sample can produce unstable results. It shouldn't be turned into a commercial claim.
The strongest contrast comes from a trading experiment on human oversight. Participants earned more when they combined robot execution with manual decisions, while shifting more trades entirely to robots reduced earnings. One additional robot increased final performance by 1.78 cents, while a 50-percentage-point increase in robot-executed trades reduced earnings by 72 cents (the trading experiment).
That evidence points to a useful operating model: automate repetitive execution and rule enforcement, but retain human judgment for market selection, regime filters, and shutdown decisions. Readers comparing the operational demands of automated systems with other technical workflows may also find these FinOps and Kubernetes case studies useful for thinking about monitoring, controls, and failure recovery.
A Practical Checklist to Test Your Own Bot
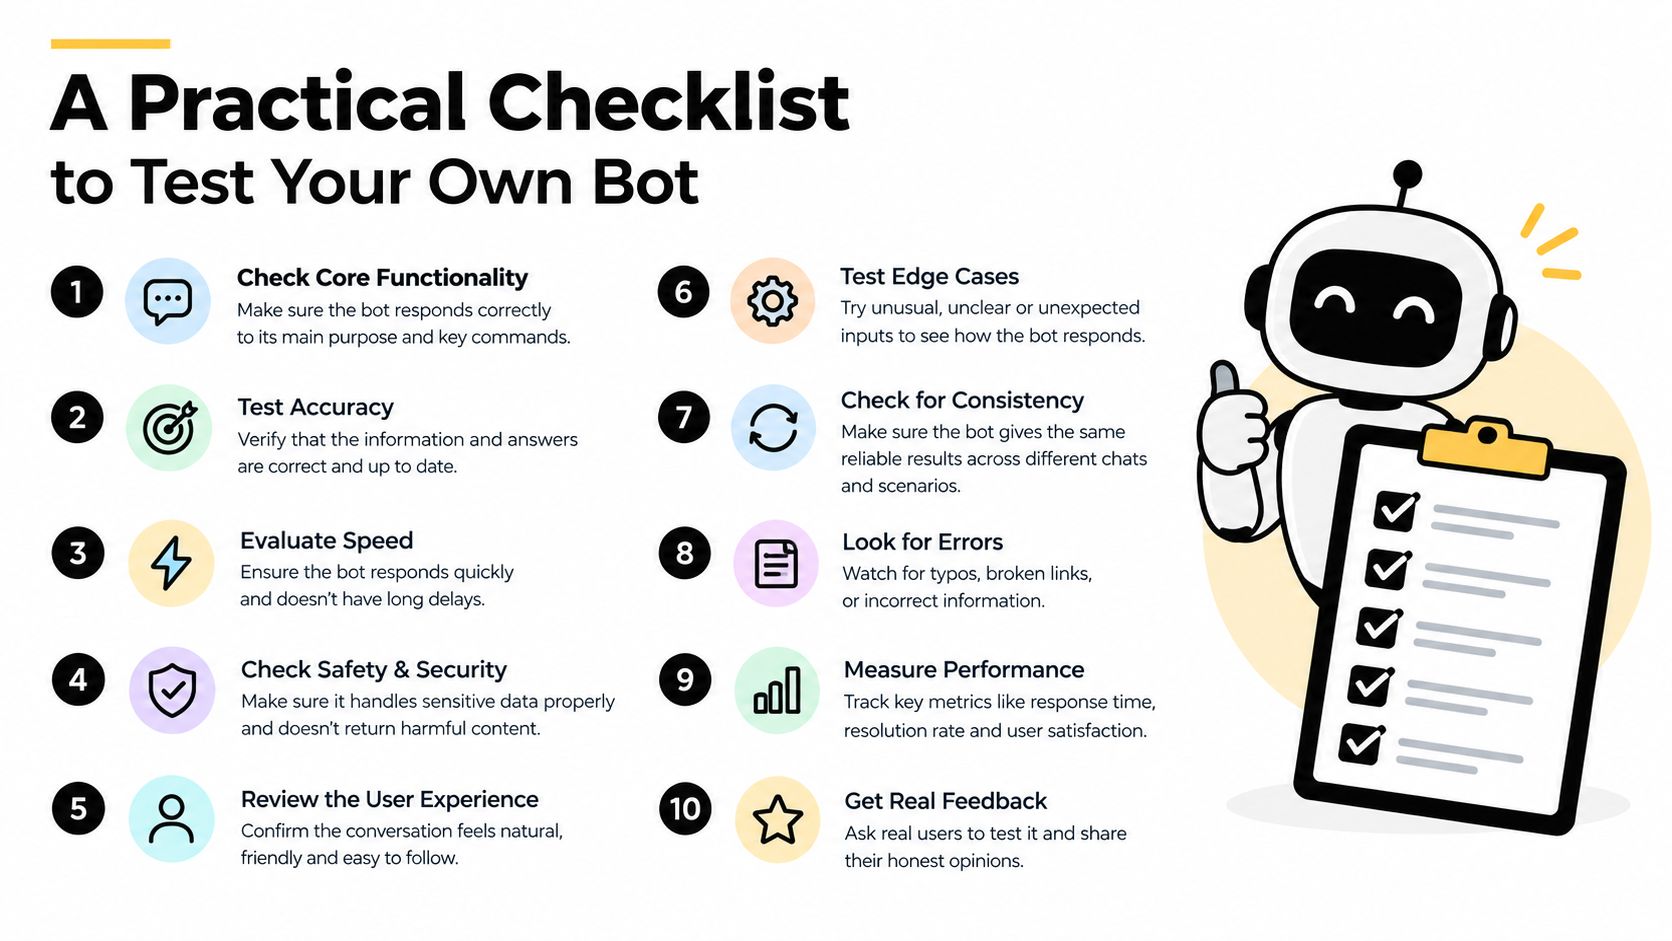
You can run a meaningful first review within a trading week, but a review isn't the same as proof. Use it to eliminate weak systems before they reach live capital.
Separate the data. Test on unseen data and run walk-forward validation. Don't tune parameters on the same period used to judge performance.
Paper trade for 30 sessions. Record signal time, intended price, actual simulated fill, spread, slippage, rejected orders, and net P&L.
Turn on every cost. Include commissions, spread, slippage, financing or funding charges where relevant, and subscription costs. A grossly profitable strategy can be net negative after these deductions.
Demand a meaningful sample. Require at least 100 trades before drawing a preliminary conclusion. A small number of wins can make a fragile strategy look exceptional.
Check risk-adjusted results. After costs, look for a profit factor above 1.3, Sharpe above 1.0, and drawdown that fits the account's loss limits. These are filters, not guarantees.
Test different regimes. Ask whether the bot can operate through both a trending month and a choppy month. If it only works in one environment, define when it must pause.
Install a kill switch. If live expectancy deviates by more than 2x from the backtested expectancy, stop the bot and investigate. Check fills, data, costs, code changes, and market conditions before restarting.
Keep a separate log for strategy performance and system health. A losing week caused by a changed market regime requires a different response from a losing week caused by rejected orders or broken data.
Realistic Expectations and Prop Firm Funding
A disciplined retail bot should be expected to deliver modest results, not passive income. Published evidence does not support treating automation as a reliable income machine, and many retail systems underperform a simple benchmark after costs. Judge a bot by net return, drawdown, consistency, and opportunity cost, rather than by a balance increase during one favorable period.
The main drivers are strategy quality and cost discipline. More complex code cannot create a durable edge where none exists. A transparent rule set with careful validation and efficient execution can therefore be more useful than an opaque model that looks exceptional in a backtest.
Which strategies are most profitable?
Trend-following on liquid futures and statistically sound mean reversion on major FX pairs have the clearest practical case for retail use. Trend systems may endure deep drawdowns. Mean-reversion systems can fail when a range turns into a sustained trend. Their profitability depends less on the label than on whether the strategy survives changing conditions and real execution.
Arbitrage, market making, and HFT can work in suitable institutional settings. Their latency, infrastructure, inventory, and capacity requirements make them poor starting points for most retail traders. Earlier HFT research shows that automated profitability exists, not that a retail terminal can reproduce the same results.
Are free or paid bots better?
Free and open-source bots provide transparency and let technically capable traders inspect the logic. They still require coding, testing, monitoring, and maintenance. Paid bots offer convenience, but vendors often provide no audited live record. The subscription may therefore purchase software access without demonstrating a proven edge.
Assess the underlying strategy, execution record, costs, and risk controls. The label “AI” does not establish that a system can adapt safely.
Are crypto trading bots profitable?
Yes, for a small minority of operators and only under suitable conditions. Market-neutral and grid approaches may fit major pairs when liquidity and market behavior match their design. Volatility, exchange risk, slippage, and regime changes can then remove the apparent edge. A recent comparison found only 5 of 22 model-seasons profitable, with no model remaining profitable across both seasons (Traderank's comparison).
Crypto markets trade continuously, giving a bot more operating hours without creating positive expectancy. More activity can increase fee drag when the signal is weak.
How long before a bot is proven?
Treat six months of out-of-sample and live data across at least 200 trades as a minimum for a serious edge claim. The sample should include different market conditions and actual execution costs. This remains no guarantee, but it is more credible than a short backtest or an isolated screenshot.
A funding evaluation can test a validated algorithmic strategy against defined risk limits. MyFundedCapital offers simulated accounts using real market quotes, supports manual and automated trading, and provides Instant Funding alongside 1-Step and 2-Step Challenges. Its account sizes range from $5K to $100K, with scaling paths up to $500K and profit splits starting at 80/20 (MyFundedCapital). Published parameters include a flat 5% daily loss limit and up to 10% maximum drawdown. A bot must be configured for those limits, not merely optimized for return.
Funding does not repair a weak strategy. It places a tested approach inside a different capital framework, while the account rules add another execution constraint. Futures and CFD trading carry substantial risk of loss, and automation does not remove market, technical, liquidity, or operational risk. This article is educational only and is not financial advice.
Review the bot against the checklist, measure live costs, and compare results with a clear benchmark before risking capital. If the strategy survives that process, compare the available MyFundedCapital funding programs and choose an evaluation path that matches its drawdown and trading rules.
