You mark out a clean support level, price taps it, and then snaps higher without giving your RSI or MACD anything useful. A few candles later, the move is gone and you're left staring at a chart that only shows the outcome, not the fight that caused it.
That's where order flow analysis earns its place. It doesn't predict the future. It shows who's getting aggressive, who's absorbing pressure, and whether a move is being accepted or rejected.
Why Traditional Indicators Fail and What Order Flow Reveals
Most traditional indicators summarize what already happened. They smooth price, calculate momentum from past bars, and give you a delayed read on a market that can change character in seconds.
That doesn't make them useless. It just means they often fail at the exact moment you need precision most. A support test, a breakout retest, or a fast rejection near session highs usually gets decided by active buying and selling at specific prices, not by whether an oscillator finally rolled over.
What the candle doesn't tell you
A candle can show rejection, expansion, or compression. It can't show whether buyers lifted the offer aggressively and still got absorbed, or whether sellers hit bids repeatedly and failed to push price lower.
That difference matters.
If price pushes into resistance and stalls, you need to know whether:
- buyers are still in control and pausing before continuation
- large passive sellers are absorbing every aggressive buy
- late breakout traders are getting trapped near the highs
Order flow analysis helps answer those questions in real time.
Order flow is best used as a context tool near important levels, not as a reason to fire trades in the middle of nowhere.
Why this matters more than another indicator
When traders first learn order flow, many make the same mistake. They treat it like a magic entry trigger. It's not. It's a way to read the auction under the chart. If you already understand structure, value, and acceptance, order flow gives you a sharper lens.
That's why traders who already use market structure often pair order flow with ideas from auction market theory. Price isn't random noise on a screen. It's an auction, and order flow lets you watch that auction happen instead of judging it after the close of the bar.
The practical edge is simple. You stop asking only, “Where is price?” and start asking, “Who is forcing trade here, and is the other side absorbing it?”
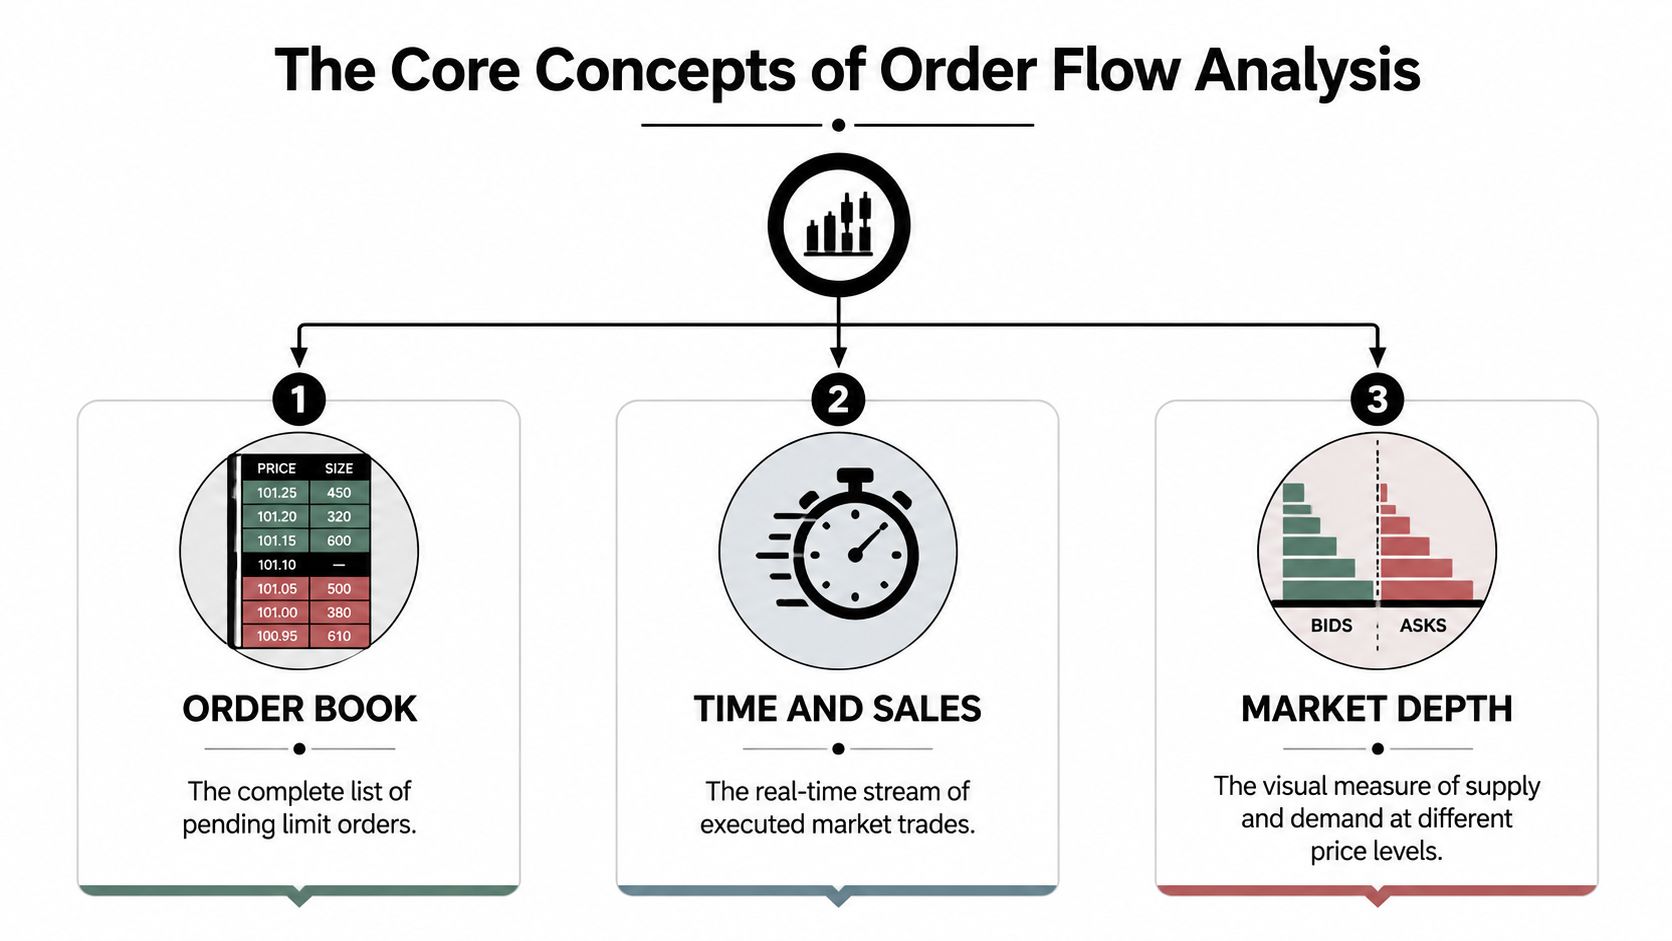
The Core Concepts of Order Flow Analysis
Order flow analysis became a cornerstone of modern trading in the early 2000s, as electronic platforms gave traders access to real-time data. A key development came in 2002, when CME Group's Globex platform let futures traders visualize Depth of Market (DOM) data across multiple price levels, as described by Optimus Futures on the development of order flow tools.
Think of the market like a live auction. Some participants are posting prices where they're willing to buy or sell. Others step in and hit those prices immediately. Order flow starts with watching that interaction.
Order book
The order book is the full list of resting buy and sell limit orders waiting to be matched. These orders provide liquidity.
In practical terms, the order book tells you where traders are willing to do business before price gets there. It's intention, not execution.
A few things matter here:
- Resting bids show where buyers are willing to step in
- Resting offers show where sellers are willing to unload inventory
- Changes in size can hint at interest, hesitation, or gamesmanship
A beginner mistake is assuming every large order in the book is real. It isn't. Some orders are genuine. Some get pulled. Some are placed to influence perception. That's why the order book alone is never enough.
For a cleaner explanation of how transactions happen at each side of the market, it helps to review the difference between bid and ask.
Depth of Market and Time and Sales
The DOM is the visual version of the nearby order book. It shows the pending buy and sell orders stacked by price, usually centered around the current market.
The Time and Sales window, often called the tape, shows executed trades as they print.
Here's the distinction that matters:
| Tool | What it shows | What it answers |
|---|---|---|
| Order book | Resting limit orders | Where is liquidity waiting? |
| DOM | Real-time depth near current price | Is liquidity building, pulling, or holding? |
| Time and Sales | Completed trades | Who is actually hitting and lifting? |
If the DOM shows heavy offers above price but the tape keeps printing aggressive buys and price still climbs, sellers may be getting run over. If the tape shows repeated sells into a level and price won't break lower, someone may be absorbing that pressure.
How the three fit together
Used together, these tools give you a more realistic read:
- The order book shows potential
- The DOM shows nearby liquidity
- The tape confirms what traded
Screen rule: Trust executed trades over displayed liquidity. Printed volume matters more than what traders only advertise.
That's the heart of order flow analysis. You're not guessing from the finished candle. You're watching the auction happen one decision at a time.
Decoding Key Order Flow Indicators
Raw DOM and tape data can overwhelm newer traders fast. That's why most traders use visual tools that compress the noise into something usable.
The three tools that matter most on screen are footprint charts, volume profile, and cumulative volume delta. Each answers a different question, and each becomes more useful when you stop trying to use it everywhere.
Footprint charts
A footprint chart opens up the candle and shows traded volume at each price inside that bar. Instead of only seeing open, high, low, and close, you see where buyers and sellers did business.
That matters because some candles look strong on the outside but weak on the inside. A bullish candle that closes well can still show heavy selling absorption near the highs.
What footprint charts answer:
- Where inside the candle did business get done?
- Were buyers lifting the ask or sellers hitting the bid?
- Did aggressive activity move price, or get absorbed?
One of the clearest concepts here is volume delta, calculated as Bid volume minus Ask volume. It's used as a real-time read on institutional absorption. Research cited by TradeFundrr's discussion of volume delta and absorption says absorption patterns, where price stabilizes despite heavy market-order pressure, achieve 75-80% success rates as reversal indicators, especially when paired with CVD divergence.
That doesn't mean every positive or negative delta is tradable. It means delta gets useful when it appears at a level that already matters.
Volume profile
Volume profile shows how much volume traded at each price over a session or selected range. It's one of the simplest ways to separate fair value from rejection zones.
The practical questions it answers are:
- Where did the market spend time and transact heavily?
- Which prices were accepted?
- Which prices were rejected quickly?
A profile is especially helpful if you already use VWAP or session structure. If that's part of your process, this guide on how traders use VWAP in intraday context fits naturally alongside order flow work.
What works with volume profile:
- High-volume areas often matter as areas of balance
- Low-volume areas often tell you where price can move quickly
- Retests near session value usually give cleaner reads than random mid-range entries
Cumulative Volume Delta
Cumulative Volume Delta, or CVD, tracks the running difference between aggressive buying and aggressive selling over time. It doesn't replace structure. It helps confirm or question it.
A useful way to think about CVD is this. Price shows where the market moved. CVD shows how hard one side had to push to create that move.
Watch for divergence:
- Price makes a fresh high, CVD weakens
- Price makes a fresh low, CVD improves
- Price stalls while delta keeps pressing into a level
If price extends but CVD doesn't confirm, don't rush to fade the move. Wait for failure, absorption, or trapped traders to show up.
Used properly, these indicators don't give certainty. They give better context. That's enough to improve timing and keep you out of bad entries.
Practical Order Flow Trading Setups
Theory matters less than what you can recognize live. Good order flow setups are usually simple on paper and difficult in real time because the tape moves fast and traders get emotional.
The best approach is to trade order flow only at preplanned locations. If the level doesn't matter before the market gets there, the data usually becomes noise.
Absorption at a key level
This is one of the cleanest order flow trades when it appears at a session high, low, prior value edge, or obvious intraday pivot.
The pattern looks like this:
- Price tests a known level
- Aggressive orders keep hitting into that level
- Price stops progressing
- The opposite side takes control after the pressure stalls
A practical example from Bookmap's explanation of DOM and footprint integration describes a footprint showing persistent buying pressure such as +45 delta at a price level while the DOM shows only light visible bids. That imbalance can signal hidden iceberg buying or selling pressure absorbing the other side.
What I'd look for on screen:
- Repeated market orders into the level
- Little or no price progress
- A quick shift in tape speed after the stall
- Failure of the aggressive side to continue
Entry is usually best after the first failure, not on the first touch. The market often needs one more push to trap traders.
Delta divergence reversal
This setup works best after an existing push, not inside chop.
You get a move to fresh highs or lows, but the underlying aggression stops confirming. Price may still print the new extreme, but the engine behind the move is fading.
The logic is straightforward:
| Condition | What you want to see | Why it matters |
|---|---|---|
| Price extension | New high or low into a marked area | Pulls in breakout traders |
| Delta divergence | Aggression weakens against the price move | Shows reduced follow-through |
| Failure signal | Price can't hold outside the level | Suggests rejection, not acceptance |
The trap here is entering too early. Divergence by itself is not a trade. Strong markets can keep grinding while divergence gets worse. Wait for a failed hold, an absorption read, or a rotation back through the trigger area.
Exhaustion and trapped traders
This setup often shows up late in a move when everyone finally agrees with the direction. That's usually when risk gets worst.
The sequence tends to be:
- Fast directional push
- Heavy participation near the end of the move
- No meaningful continuation
- Quick reversal as late entrants get trapped
Late momentum entries usually look strongest right before they stop working.
On the tape, exhaustion often feels obvious once you've seen it enough. Prints stay active, but price stops responding. The move looks loud and goes nowhere. Then the reversal starts and trapped traders fuel the other side.
The practical lesson is simple. Don't chase the move that already spent its energy. Let order flow show whether price is still being accepted, or whether the last buyers or sellers are just providing liquidity to stronger hands.
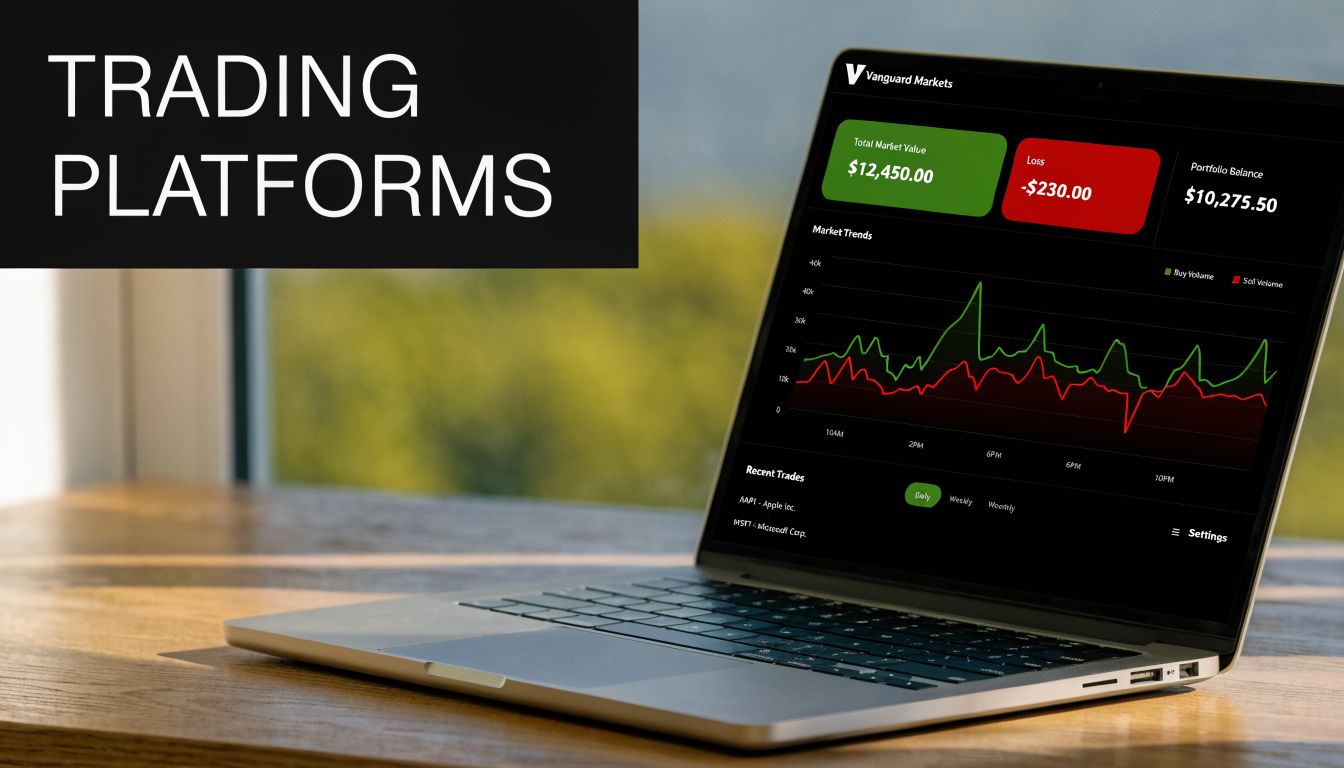
Choosing Your Order Flow Platform and Tools
The hard truth is that good order flow analysis usually needs better tools than a standard retail chart package gives you. But that doesn't mean you need the most expensive setup on day one.
For most traders, the platform decision comes down to three things:
- What market you trade
- How deep you want to go
- How much complexity you can handle without slowing yourself down
Built-in platform tools
Platforms like cTrader give you a reasonable starting point. You may get basic market depth, volume-based tools, and a cleaner execution interface than older platforms.
That's enough to start learning:
- Basic DOM behavior
- How bid and ask interact near key levels
- Whether your strategy even benefits from order flow
For many traders, that's the right first step. If you can't use simple information well, adding more windows won't fix the problem.
Mid-range add-ons and custom indicators
This tier includes plugins, indicators, or lighter external tools that add footprint-style views, delta, or profile analysis without forcing you into a full professional suite.
These can work if you want:
- More visual detail than built-in tools
- A smaller learning jump
- A way to test whether footprint and delta improve your execution
The trade-off is reliability and data quality. Some add-ons look impressive but don't provide the same depth or consistency as a dedicated platform. That's where many traders waste money. They buy visuals instead of usable data.
Professional order flow suites
Platforms such as ATAS, Sierra Chart, and Bookmap are where serious order flow traders usually end up if they commit to the style.
These are stronger for:
- Footprint charts
- DOM detail
- Heatmap-style liquidity views
- Tape reading and replay
But there are trade-offs.
| Platform tier | Best for | Main drawback |
|---|---|---|
| Built-in tools | Learning the basics | Limited depth and visualization |
| Add-ons | Testing concepts cheaply | Mixed data quality and consistency |
| Professional suites | Deep execution analysis | Steeper learning curve |
A common mistake is overbuilding the workstation before building the skill. Start with one market, one session, and one or two tools you can read under pressure. If you trade forex, indices, or crypto on platforms like cTrader or DXtrade, focus first on whether your data and execution style support the decisions you want to make. Then upgrade only when the limitation is real, not imagined.
Risk Management with Order Flow for Funded Traders
For a funded trader, the main value of order flow analysis isn't finding more trades. It's filtering out weak ones.
That matters because funded trading rules punish sloppiness fast. If your daily loss limit is fixed and your maximum drawdown is absolute, you don't need extra activity. You need fewer bad decisions.
Use order flow as a filter
A setup may look clean on structure alone, but order flow can tell you when not to touch it.
Examples:
- Breakout looks strong, but buyers can't hold above the level
- Price tags support, but aggressive sellers keep getting absorbed
- Momentum trade sets up, but delta stops confirming the push
That last one has real statistical support. A 10-year analysis of NASDAQ stock data found that cumulative volume delta divergences forecasted reversals in 68% of cases within 15 minutes, according to Cyber Trading University's summary of the divergence data. The practical takeaway isn't to auto-fade every divergence. It's to avoid entering blindly against weakening pressure.
What keeps traders safe
The safest way to use order flow is as a final checklist before entry:
- Is this level already important on structure?
- Is aggression confirming my idea, or fighting it?
- If I'm wrong, is the failure obvious and small?
Good funded traders survive because they pass on trades that look fine to everyone else.
Order flow won't save a reckless trader. It does help a disciplined trader avoid donating losses into hidden absorption, failed breakouts, and late-session noise.
Trading involves risk of loss. Educational use only, not financial advice.
Common Questions About Order Flow Analysis
Can I use order flow for swing trading
You can, but it's far more useful for intraday decision-making. Order flow shines when you care about immediate participation, failed pushes, and short-term acceptance or rejection.
For swing trades, the signal decays faster because the holding period is longer. Most traders get more value using order flow to refine entries on a swing idea than to manage the entire trade from it.
Does order flow analysis work in forex and crypto
It can, but you need to understand the data limits. Centralized futures markets usually give cleaner order flow reads because the exchange data is consolidated.
Forex and crypto can still be tradable with order flow principles, especially through platform depth tools, execution reads, and volume-based proxies. Just don't assume the data is as complete as centralized futures data.
Do I need expensive software to get started
No. You need a platform you can read and a process you can repeat.
Start with:
- One market
- One session
- A basic DOM or depth view
- A simple profile or delta tool if available
If order flow helps you avoid poor entries and tighten decision-making, then better software starts making sense. If you're still forcing trades at random levels, expensive software just gives you more ways to rationalize bad decisions.
Is order flow analysis enough on its own
Usually not. It works best when paired with structure, levels, and risk control.
Think of it as a confirmation layer. It tells you whether the market is accepting your idea right now. That's powerful, but it doesn't replace trade location, discipline, or hard risk limits.
If you want to apply these ideas in a structured prop environment, explore MyFundedCapital. You can compare challenge and instant funding options, trade on cTrader or DXtrade, and practice disciplined execution under clear risk rules. Trading involves risk of loss, and funded accounts are simulated evaluation environments, so treat the challenge like a professional assessment, not a shortcut.