

 NL
NL
 EN
EN
 FR
FR
 DE
DE
 ES
ES
 IT
IT
 PL
PL
 SV
SV
 PT
PT

Position size equals your allowed account risk divided by the dollar risk per unit, then reduced until it fits the prop firm's 5% daily loss limit and 10% maximum drawdown. The formula protects you only when its output also complies with the account rules, contract size, stop distance, and total exposure.
You're trading simulated capital, not your own cash balance, but the consequences still feel real when a daily limit closes the account or a drawdown breach ends an evaluation. I've blown accounts by calculating a perfectly reasonable trade in isolation, then discovering that the position was too large for the firm's limits once spreads, correlated trades, and open losses were included. This guide connects the main risk management formulas to account survival, funded trading rules, and practical execution. Trading involves risk of loss, and this article is educational content, not financial advice.
Why Risk Management Formulas Fail in Prop Trading
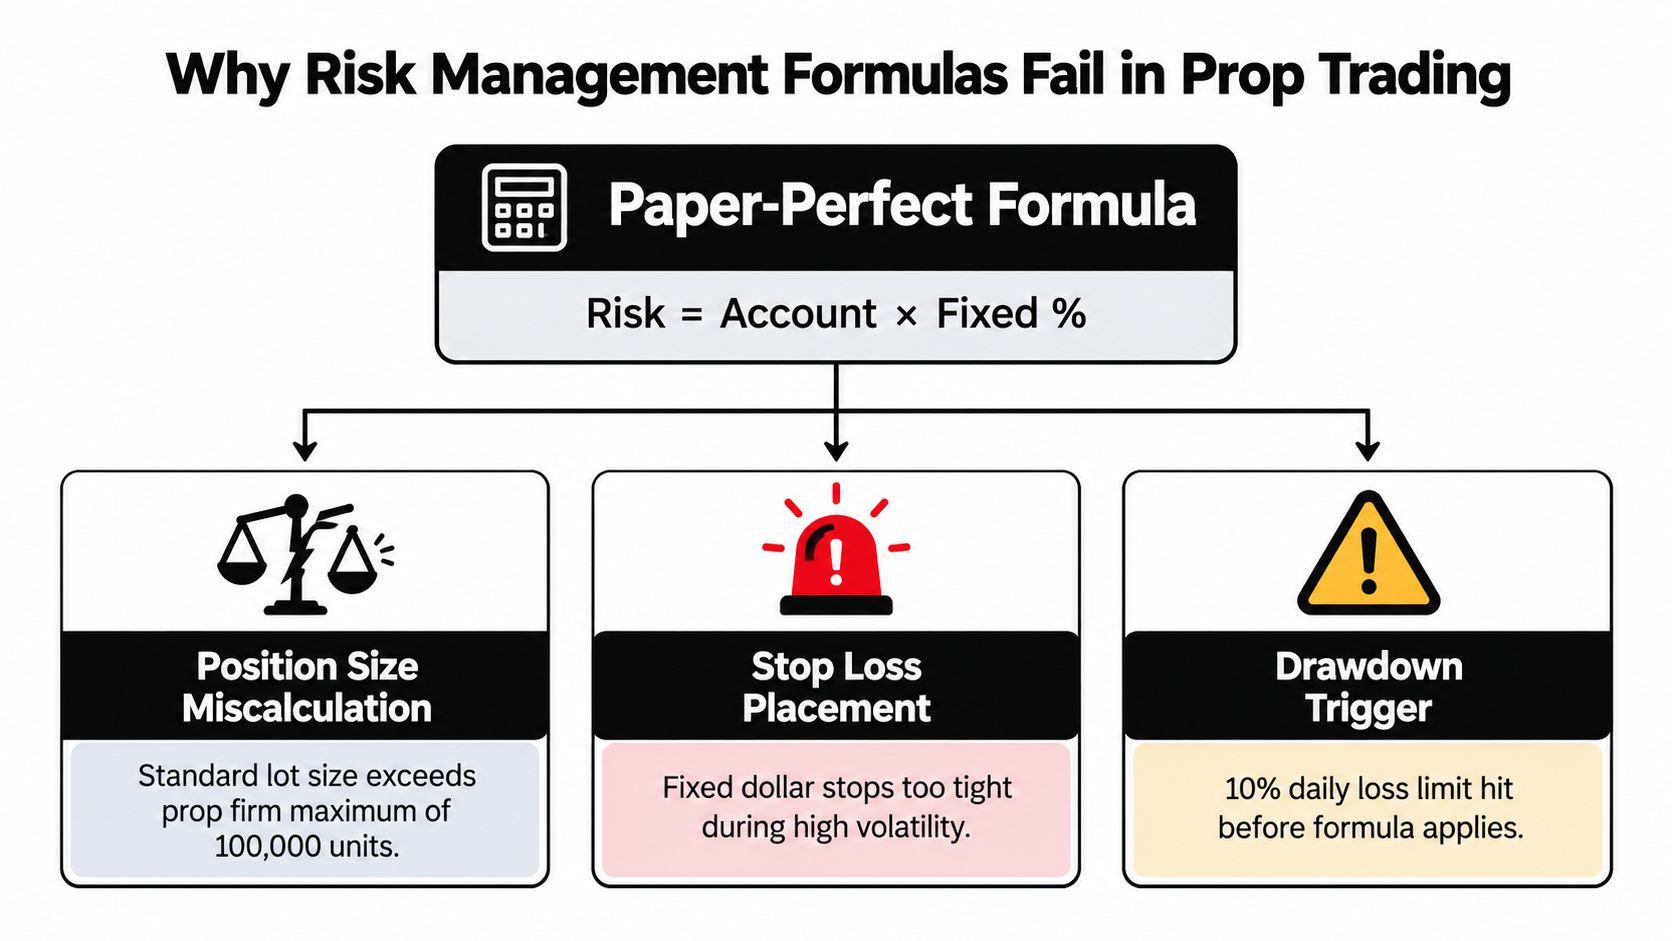
Most risk formulas work on paper because paper usually gives them clean inputs. You know the account balance, choose a percentage, measure the stop, and calculate the position. Prop trading adds conditions that can invalidate the result before the order reaches the market.
A fixed-fractional formula may produce a position below the platform's minimum contract size. It may also produce a position that fits one trade but violates the daily loss limit after spread, commission, slippage, or another open trade is included. On a volatile instrument, a stop that looks financially acceptable can be too tight for normal price movement.
The single-trade blind spot
Most beginner guides focus on one position. That approach misses portfolio heat, correlation-adjusted exposure, and concentration risk. A long forex position, a long index position, and a long crypto position can express the same broad directional view even though each trade has its own stop and position-size calculation.
The more useful question isn't, “How large should this trade be?” It's, “How much can the account lose if several trades fail together?” Recent discussions of trading risk increasingly separate basic position sizing from portfolio-level measures such as effective risk and heat caps, while many explanations still stop at a flat risk percentage per trade. The practical gap is described in this overview of portfolio-level risk management.
Prop rules override elegant mathematics
A formula doesn't know that the platform rounds contracts upward. It doesn't know that the firm stops trading at a maximum drawdown threshold instead of allowing you to continue with smaller size. It also doesn't know that a minimum tradable unit may risk more than your chosen budget.
That's why the output can be:
- Too small to trade: The calculated size falls below one tradable unit, so the correct decision is often to skip the setup.
- Too large for the account: Rounding up to meet a minimum contract size creates more risk than the formula authorized.
- Too concentrated: Several trades share the same currency, index, sector, or market impulse.
- Too fragile: A fixed stop ignores widening volatility and normal fluctuations.
- Rule-incompatible: The trade may be mathematically sound but breach a daily loss or maximum drawdown rule when combined with existing positions.
Value at Risk became a formal market-risk standard in 1996, when the Basel Committee's Market Risk Amendment allowed banks to use internal VaR models for regulatory capital. That framework used a 99% confidence level over a 10-day horizon, with a capital multiplier of at least 3 and up to 4 depending on backtesting performance, as documented in this history of Value at Risk. The lesson for traders isn't to copy bank VaR. It's that risk becomes useful only when a descriptive concern turns into a defined, testable limit.
Practical rule: Treat every formula as a ceiling, not a permission slip. If the result conflicts with a firm rule, the firm rule wins.
Risk management is also a professional discipline beyond trading. Anyone exploring job opportunities in risk management can see how risk work extends into controls, monitoring, and decision-making. Those same habits matter in a funded account. You need an owner for the risk, a trigger for stopping, and a process that prevents one bad decision from becoming an account-ending sequence.
The Fixed Fractional Position Sizing Formula
The fixed fractional method starts with a simple promise: decide how much money you can lose before you decide how many units to trade. The standard formula is:
Position size = account risk ÷ dollar risk per unit
Account risk comes from equity multiplied by the chosen risk percentage. Dollar risk per unit comes from the distance between entry and stop, multiplied by the value of each point, pip, or price unit. This stop-based logic is also described in the day-trading risk-reward calculator guide.
A complete calculation
Use the required example:
- Account equity: $20,000
- Risk allocation: 1%
- Risk budget: $20,000 × 0.01 = $200
- Entry-to-stop distance: $2 per share
- Dollar risk per share: $2
- Position size: $200 ÷ $2 = 100 shares
The trade risks $200 if the stop executes at the planned price, before any additional trading costs or execution differences. The formula is useful because it forces the stop to define the position rather than allowing a trader's emotional comfort to define it. A stop-loss-based method explicitly ties actual risk to the entry-to-stop gap multiplied by position size, as explained in this stop-loss sizing article.
The same principle applies to contracts, lots, and crypto units. Replace the per-share risk with the dollar risk of one tradable unit, then divide the budget by that figure. A position size calculator can reduce arithmetic errors, but it can't decide whether the result complies with your account rules.
Why rounding can break the trade
Suppose the calculation returns 0.37 contracts, but the platform accepts only whole contracts. Rounding down may leave you with no trade or less exposure than planned. Rounding up gives you a position that risks more than the formula allowed. In a prop account, the safe default is to round down, then reassess whether the trade remains worthwhile.
A mathematically valid position can also breach a loss limit after you add:
- Existing open risk: Include losses at the current stop, not only closed trades.
- Correlated exposure: Group trades that could lose during the same market move.
- Execution costs: Allow for spread, commission, and slippage.
- Daily headroom: Reserve room for the possibility that another valid setup appears later.
- Contract restrictions: Check minimum and maximum sizes before submitting the order.
Pre-trade validation checklist
- Calculate equity risk. Multiply current equity, not your original account size, by the chosen risk fraction.
- Measure the stop distance accurately. Use the executable entry and stop, not a chart shortcut.
- Convert to dollar risk. Include the value of one pip, point, share, coin, or contract.
- Round down. Never increase size merely to reach a convenient lot or contract number.
- Add current exposure. Recalculate total loss if all correlated stops are hit.
- Check daily loss space. Include realized and floating losses, plus trading costs.
- Check maximum drawdown space. Stop trading when the account reaches its stated threshold.
- Reject the trade if the minimum size is too risky. No position is safer than an oversized position.
The formula is a starting gate. It doesn't guarantee a good trade, a successful evaluation, or a profitable strategy.
Kelly Criterion vs Fixed Fraction for Prop Accounts
The Kelly Criterion answers a different question from fixed fractional sizing. Fixed fractional sizing says, “Risk this portion of the account on each trade.” Kelly attempts to determine the fraction that maximizes long-term geometric growth from a known edge.
For a simple win-loss model, the formula is commonly written as:
Kelly fraction = (b × p − q) ÷ b
Here, b is the net reward relative to the risk, p is the probability of a win, and q is the probability of a loss. The calculation assumes that the estimated win rate, payoff ratio, and distribution of outcomes are reliable. In live trading, those inputs shift with market regime, execution, sample size, and trader behavior.
Side-by-side comparison
| Metric | Fixed Fractional | Full Kelly | Fractional Kelly |
|---|---|---|---|
| Main purpose | Keeps each trade within a chosen risk budget | Maximizes modeled geometric growth | Reduces Kelly's aggressive exposure |
| Account-size change | Dollar risk rises or falls with equity | Position fraction follows the estimated edge | Position fraction follows the edge at a reduced level |
| Win-rate change | Usually unchanged unless the trader changes the rule | A higher estimated win rate can increase size sharply | A higher estimated win rate increases size more conservatively |
| Reward-to-risk change | Stop and target may change trade selection, but risk budget stays defined | A better payoff ratio can materially increase the calculated fraction | The same edge adjustment is dampened |
| Drawdown behavior | Predictable if execution matches the plan | Can produce deep losing sequences | More compatible with strict limits |
| Prop-account fit | Usually practical after rule checks | Poor, because growth optimization ignores hard account barriers | More usable, but still requires a drawdown cap |
Full Kelly is dangerous in a funded environment because it optimizes growth, not survival under a hard evaluation rule. A losing streak can push the account toward its maximum drawdown before the statistical edge has time to express itself. The formula also assumes that the trader's probability estimate is accurate, which is a demanding assumption after costs and regime changes.
Why fractional Kelly still needs a ceiling
A trader might use one quarter Kelly or one half Kelly as a softer alternative. Those fractions reduce the output, but they don't automatically make it compliant. If the result exceeds the account's daily loss allowance, the trader must reduce it again. If the result is smaller than the platform's minimum size, the trade should be skipped.
For a prop trader, the order of operations should be:
- Estimate the edge from verified trade data.
- Calculate Kelly only as an analytical reference.
- Apply a conservative fractional adjustment.
- Compare the result with fixed fractional risk.
- Apply portfolio and drawdown caps.
- Round down to a tradable size.
Full Kelly can be mathematically attractive and operationally unacceptable. A funded account needs a risk ceiling before it needs a growth optimizer.
Fixed fractional sizing generally works better as the account's primary control because the risk is easier to audit. Kelly can help compare opportunities, but it shouldn't override a daily loss limit, a maximum drawdown rule, or a trader's ability to follow the plan during a losing streak.
Calculating Expectancy for Trade Selection
Position sizing controls the damage from one trade. Expectancy helps decide whether the trade idea deserves risk at all.
The basic formula is:
Expectancy = (win rate × average win) − (loss rate × average loss)
Use risk units so the result remains comparable across instruments. If one losing trade equals -1R, then a winner reaching a one-to-two reward-to-risk ratio produces +2R. The risk-reward relationship compares the distance from entry to target with the distance from entry to stop, as defined in this risk-to-reward ratio guide.
Three worked examples
Example one, a positive setup
Assume a 60% win rate, an average win of 2R, and an average loss of 1R.
Expectancy = (0.60 × 2R) − (0.40 × 1R) = 1.20R − 0.40R = +0.80R
That result is positive before costs and slippage. It doesn't mean the next trade will win. It means the assumed distribution has a positive average outcome over a sufficiently large and comparable sample.
Example two, a weak payoff
Assume the same 60% win rate, but the average winner is only 0.75R, while the average loss remains 1R.
Expectancy = (0.60 × 0.75R) − (0.40 × 1R) = 0.45R − 0.40R = +0.05R
The setup is only marginally positive under those assumptions. Spread, commission, slippage, and execution errors could erase the edge. Traders often confuse a high win rate with a durable strategy.
Example three, a losing setup
Assume a 40% win rate, an average win of 1.5R, and an average loss of 1R.
Expectancy = (0.40 × 1.5R) − (0.60 × 1R) = 0.60R − 0.60R = 0R
Before costs, the setup has no edge. In practice, costs make it negative, so it belongs on the rejected list unless the assumptions change.
Expectancy doesn't prevent losing streaks
A positive expectancy system can still produce clustered losses. If a volatile session produces three consecutive losses at 1R each, the immediate result is -3R, even when the long-run model remains positive. A trader who responds by doubling size turns ordinary variance into a rule breach.
Use expectancy as a filter:
- Reject negative expectancy: Don't take a setup because the chart looks attractive.
- Separate sessions: Track whether the edge survives news, low liquidity, and volatile periods.
- Use consistent definitions: A “win” should include the same exit rules across the sample.
- Include actual costs: A theoretical target is not the same as realized profit.
- Scale cautiously: Stronger evidence may justify attention, but not automatic size increases.
Expectancy is probabilistic, not deterministic. It tells you what a repeated process may produce, not what one trade must deliver. For a prop account, the formula is most useful when combined with a fixed maximum loss per trade and a session stop that prevents a temporary cluster from becoming an account-level problem.
Volatility-Based Sizing with Average True Range
A fixed stop can fail when market conditions change. A stop that fits yesterday's range may sit inside today's normal movement, creating repeated losses even though the directional idea is reasonable. Average True Range, or ATR, gives the trader a way to relate stop distance to recent volatility.
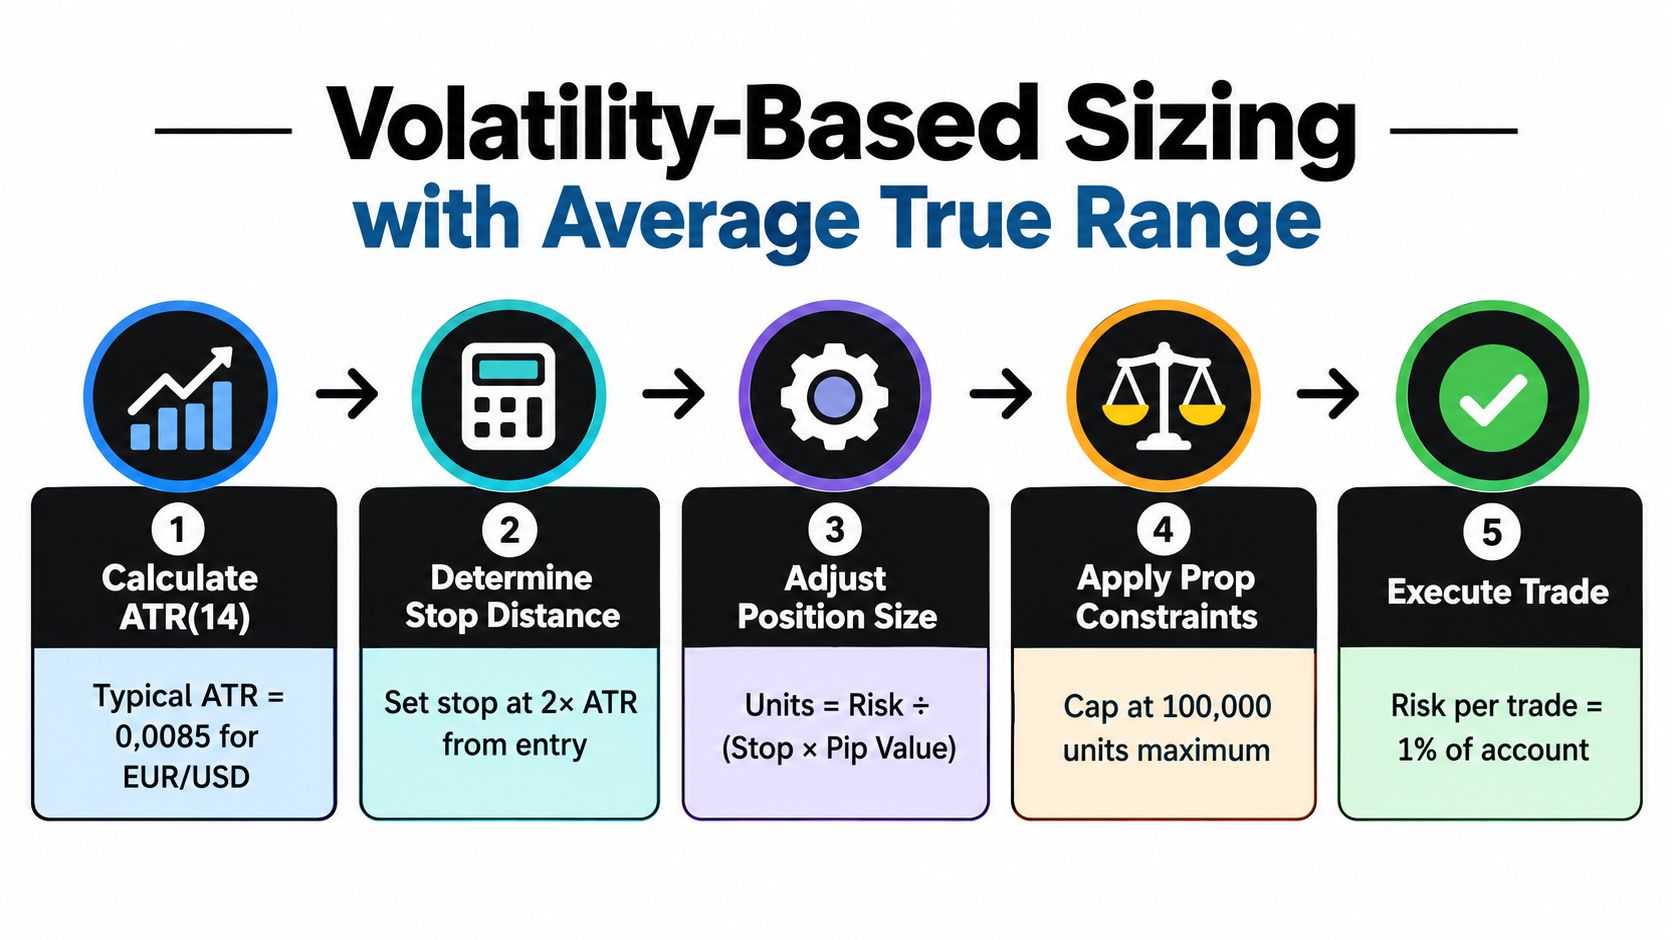
A simplified ATR process is:
- Calculate each period's true range using the current high and low, the current high against the prior close, and the current low against the prior close.
- Average the selected true-range observations.
- Set the stop using a multiple of that ATR.
- Convert the resulting distance into dollar risk.
- Divide the account risk budget by the risk per unit.
A practical explanation of the indicator is available in this guide to Average True Range trading.
A EUR/USD sizing example
Use the infographic's illustrative inputs:
- ATR(14): 0.0085 for EUR/USD
- Stop distance: 2 × ATR = 0.0170
- Equivalent distance: 170 pips
- Account risk budget: $200, based on the earlier 1% example
- Assumed value: one standard lot carries $10 of risk per pip
The assumed dollar risk for one standard lot is:
170 pips × $10 = $1,700
The unrounded position size is:
$200 ÷ $1,700 = 0.1176 lots
Round down to 0.11 lots, not 0.12. At the assumed pip value, 0.11 lots risks approximately $187 at the stop, before execution costs. This is an illustration using stated assumptions, not a guarantee that every broker or platform uses the same contract specification.
When ATR expands, the stop distance grows and the calculated position normally falls. When ATR contracts, the position may increase, but that doesn't mean the trader should automatically use the largest possible size. A calmer market can still produce a gap, news shock, or correlated move.
ATR still needs a prop-firm check
ATR-based sizing adapts to volatility, but it doesn't know the account's remaining daily headroom. Before execution, calculate the loss from the ATR stop across every open position, then compare that total with the firm's daily and maximum drawdown limits.
A trader should also ask:
- Is the ATR period appropriate for the instrument and timeframe?
- Does the stop sit beyond a meaningful invalidation level?
- Will the platform accept the calculated lot size?
- Does the position remain safe if spread widens?
- Does another position carry the same directional exposure?
ATR solves one weakness of fixed stops. It doesn't solve correlation, minimum contract sizes, or poor trade selection.
Building a Prop-Firm-Compatible Risk Framework
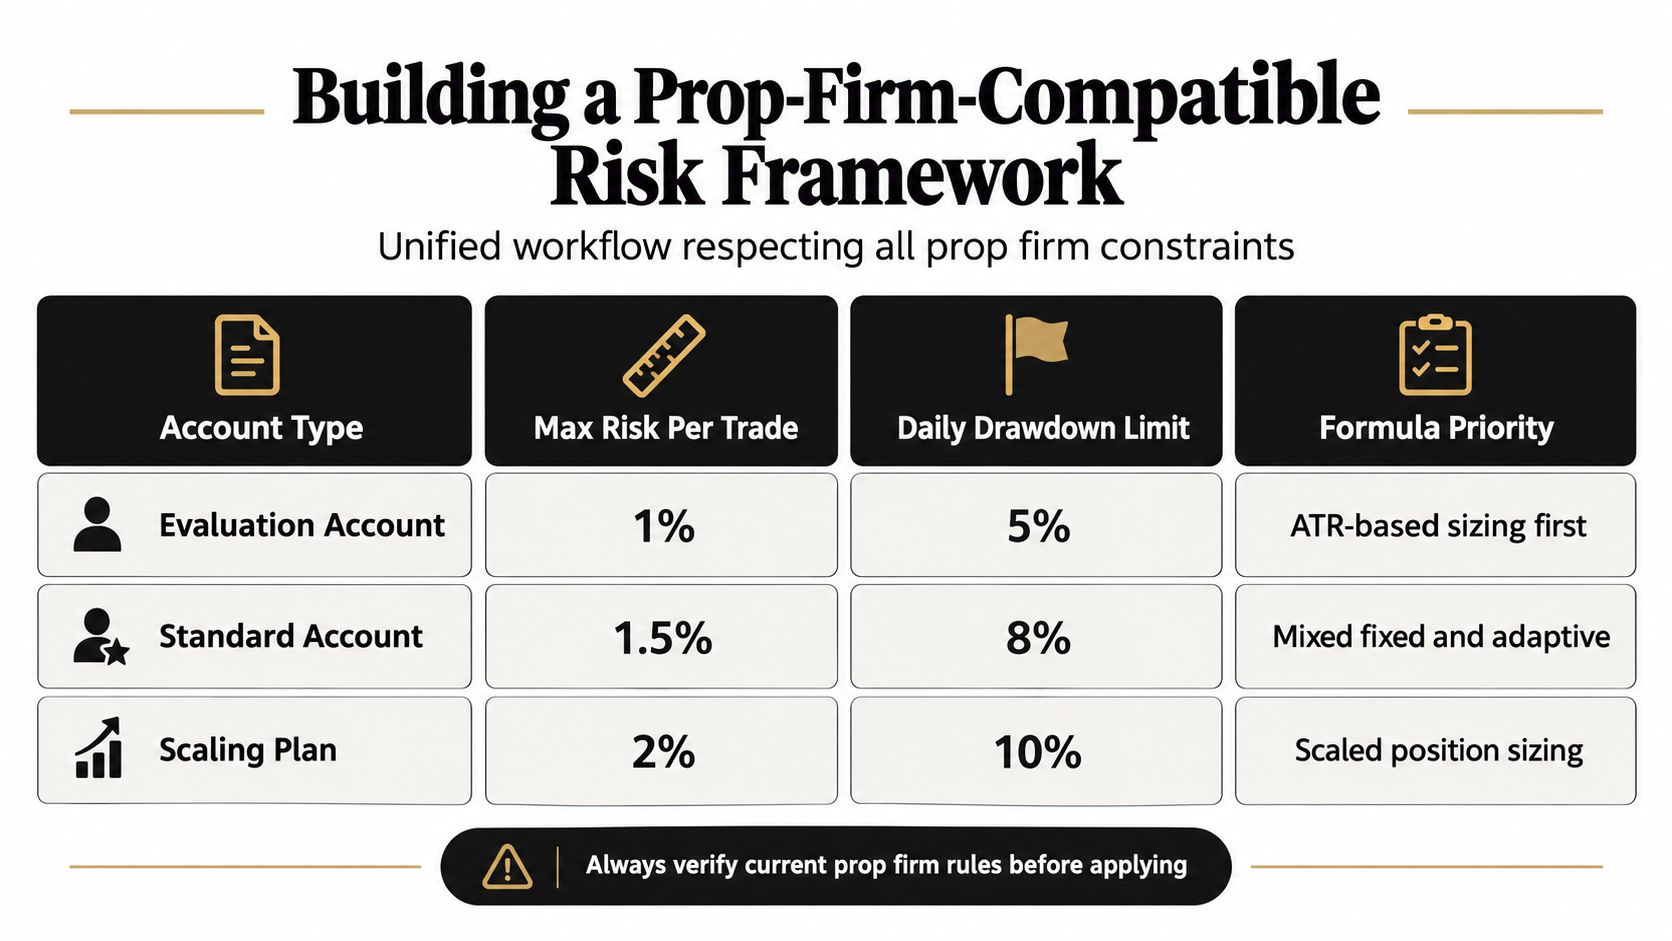
A working framework uses formulas in sequence rather than allowing one formula to control every decision. Fixed fractional sizing sets the initial budget. Expectancy decides whether the setup has a reason to exist. ATR adjusts the stop to current conditions. Kelly, if used at all, acts as a research reference rather than the account's governing limit.
The account rules remain the final filter. For an MFC-style account, the supplied parameters include a 5% daily loss limit and up to 10% maximum drawdown. Verify the current terms before trading because firms can change conditions, and a calculation is useless if it relies on an outdated rule.
The operating sequence
Start with the account. Record equity, current closed loss, floating loss, daily limit, maximum drawdown, and minimum tradable size. Don't calculate from the advertised account label if your current equity has changed.
Define the setup. Estimate expectancy from comparable trades. If the setup has no positive edge after costs, sizing it more precisely won't rescue it.
Place the stop logically. Use market structure or ATR, depending on the strategy. A stop chosen only to make the position larger reverses the correct process.
Calculate fixed fractional size. Divide the money-risk budget by the dollar loss per unit at the stop.
Use Kelly only as a restraint check. If a Kelly estimate produces a much larger position than fixed fractional sizing, that's a warning about model uncertainty, not an invitation to increase size.
Apply portfolio heat. Add the loss from all open stops, then reduce the new trade if correlated positions can fail together.
Round down and validate. If the result falls below the minimum unit, skip the trade. If it exceeds a platform cap, reduce it. Never round upward to make the trade fit.
A complete example might look like this: a trader has a $20,000 account and a $200 initial risk budget. The fixed fractional calculation permits $200, but the trader already has correlated positions carrying $120 of stop risk. The new trade must be evaluated against the remaining headroom, not against the original $200 in isolation. If the ATR stop requires more than that remaining amount, the trader either reduces the position or passes.
Decision matrix for daily use
| Account situation | Instrument condition | Formula priority | Action |
|---|---|---|---|
| Evaluation with limited drawdown space | Fast or widening volatility | ATR sizing first | Use a wider logical stop and reduce units |
| Funded account with open correlated positions | Stable volatility | Fixed fractional plus heat cap | Calculate combined loss before entry |
| Swing or weekend exposure | Gap-sensitive market | Stop distance plus scenario check | Reserve more room and avoid forced rounding |
| Algorithmic execution | Repeated signals across instruments | Expectancy plus portfolio cap | Limit simultaneous exposure |
| Small balance or restrictive contract size | Any volatility | Minimum-unit validation | Skip trades that cannot be sized safely |
The most important control is simple: the smallest permitted position must still fit the account rules. If it doesn't, there is no valid trade size.
Traders who want to study quantitative and risk-focused career paths can also search jobs on Blockchain Jobs. The same quantitative thinking applies to a funded account, where assumptions, thresholds, and exposure need to be documented rather than improvised.
For additional market-specific planning, use forex risk management strategies as a reference point, then reconcile every idea with the rules of the account you trade. A framework earns its place through execution, not through how complex its formula looks.
Final validation checklist
- Equity: Did you use current equity?
- Risk budget: Is the planned loss below your personal limit?
- Stop: Is the stop technically valid and wide enough for the market?
- Unit value: Did you use the correct pip, point, or contract value?
- Costs: Did you allow for spread, commission, and slippage?
- Correlation: Could other trades lose in the same move?
- Daily limit: Does total possible loss remain below the daily threshold?
- Drawdown: Does the account retain room after a stopped trade?
- Rounding: Did you round down?
- Execution: Does the platform accept the resulting size?
If any answer is uncertain, don't place the order.
Next Steps for Prop Traders Using These Formulas
Master one control before combining several. Start with fixed fractional sizing, then add ATR when your strategy needs volatility-adjusted stops. Keep expectancy in a journal, including actual entry, stop, exit, costs, result in R, and whether the trade followed the plan.
Paper-trade the calculation process for 30 days before changing live or evaluation size. Compare expected risk with actual risk after every session. Track clustered losses, correlated exposure, and whether the platform rounded or rejected the order. Adjust position size only after your journal contains enough comparable observations to support the change, not after one strong day or one frustrating loss.
Trading involves risk of loss. No risk management formula guarantees profits, prevents slippage, or overrides a prop firm's rules. Formulas are tools for controlling exposure, while discipline determines whether you use them consistently.
Compare MyFundedCapital account types, review the Instant Funding and Challenge options, and choose a structure whose limits you can follow without forcing trades. Then apply the same sizing, expectancy, ATR, and drawdown checks in the evaluation environment that you'll use after funding.
MyFundedCapital offers Instant Funding and 1-Step or 2-Step Challenge options with simulated capital, defined daily loss and maximum drawdown parameters, and support for manual, algorithmic, and copy trading. Visit MyFundedCapital to compare account types and start applying these risk management formulas within a real prop-firm rule set.
