Most traders start the same way. You open a chart, add a few indicators, watch price move fast, and convince yourself the next candle will finally make the setup obvious. It usually doesn't.
Technical analysis for traders only becomes useful when it gives you a repeatable process. If you're trying to pass a prop firm challenge, that process has to do more than find entries. It has to protect your daily loss limit, survive drawdown rules, and keep you from turning one bad session into a failed evaluation.
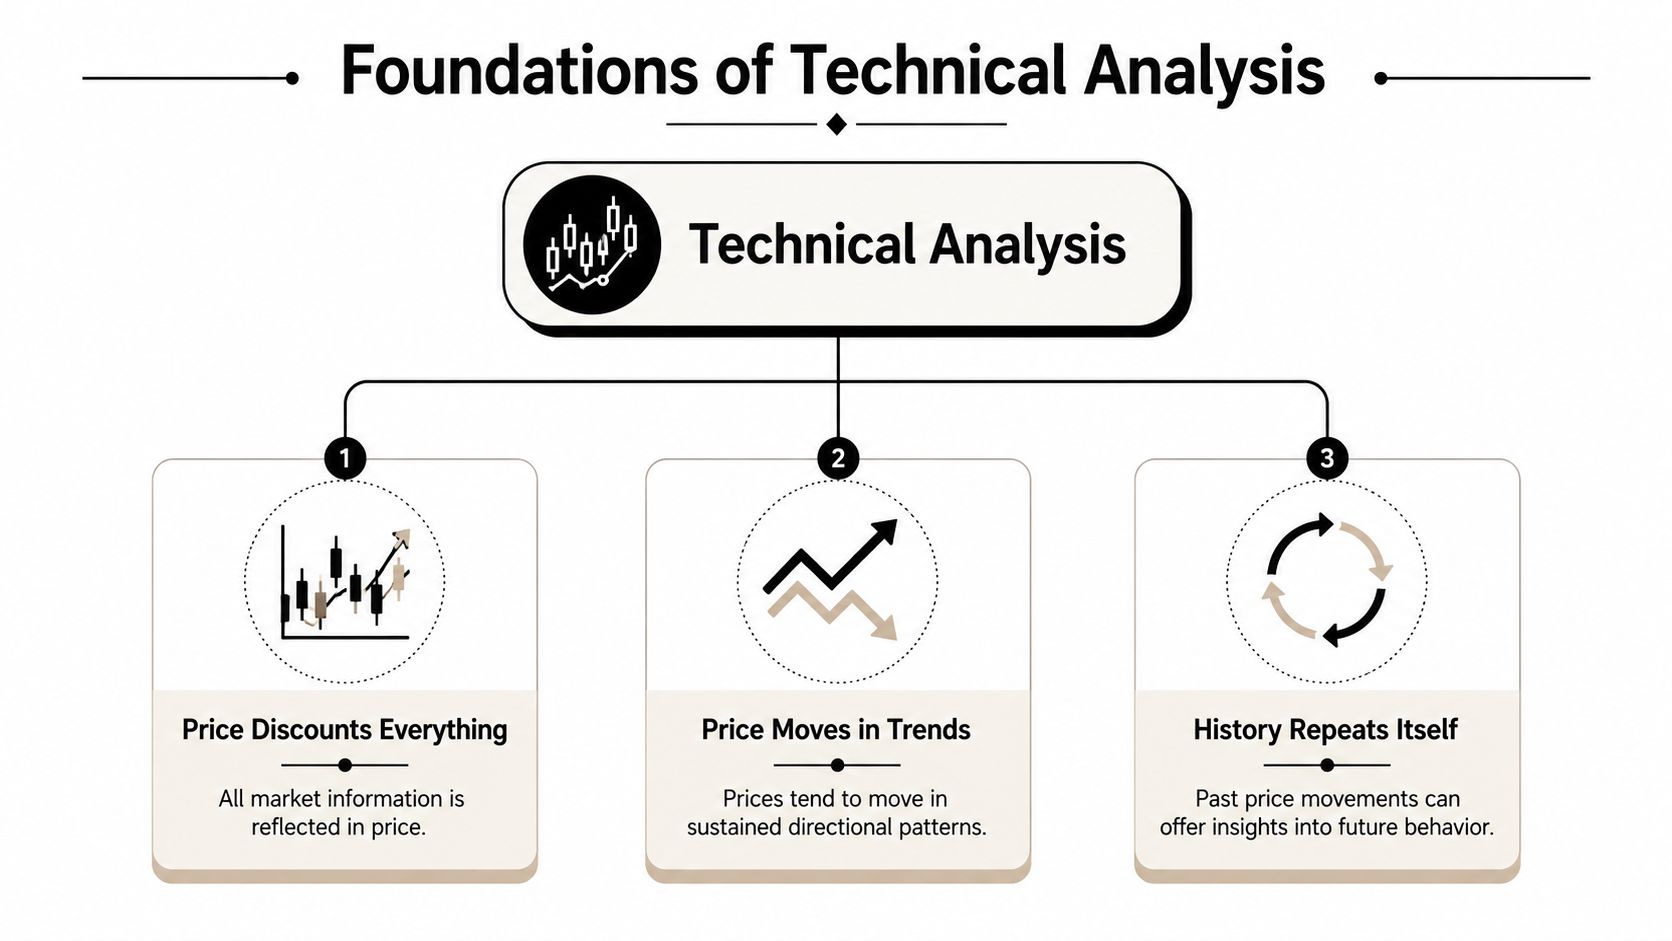
Foundations of Technical Analysis
A chart looks chaotic until you know what you're reading. Technical analysis gives structure to that chaos by treating price as a record of supply, demand, and trader behavior.
The first principle is simple. Price is the primary source of truth. Technical analysis focuses on price action and volume instead of trying to predict every news headline or macro event. The method rests on the idea that market history tends to repeat itself because fear, greed, hesitation, and panic repeat too. As noted in this overview of technical analysis history and principles, classic patterns have shown up consistently from the 1930s to the present, which is why technical analysis is grounded in recurring market psychology rather than random chance.
Price action comes first
New traders often search for the perfect indicator before they can read a basic chart. That's backward.
Start with the raw movement of price:
- Where did buyers step in before: Mark the zones where price clearly rejected lower levels.
- Where did sellers defend: Mark the areas where rallies stalled and reversed.
- How did price leave the zone: Fast rejection, slow grind, or messy chop all mean different things.
If you can't explain what price is doing without indicators, your indicators won't save you.
Practical rule: Draw your levels before adding tools. Indicators should support your read, not replace it.
Trends matter more than opinions
A lot of losing trades come from trying to call a top in an uptrend or a bottom in a downtrend. Professionals don't get paid for being early. They get paid for managing risk when the market confirms an idea.
There are only three broad conditions you need to identify:
| Market condition | What it looks like | What traders should do |
|---|---|---|
| Uptrend | Higher highs and higher lows | Favor longs until structure breaks |
| Downtrend | Lower highs and lower lows | Favor shorts until structure changes |
| Range | Price rotates between support and resistance | Trade edges carefully or wait |
That sounds basic because it is. Most traders lose money by ignoring basics under pressure.
Support and resistance are decision zones
Support and resistance aren't magic lines. They are areas where traders have already shown intent. When price reaches those zones again, you're watching for a reaction, not assuming one.
A level gets more useful when price has respected it repeatedly. If you want a clearer framework for that process, studying market structure trading will sharpen how you mark swing highs, swing lows, breaks, and retests.
Use this checklist when you mark a level:
- Find obvious swing points on the higher timeframe first.
- Refine the zone instead of pretending price respects a single exact line.
- Watch the reaction when price returns. Strong rejection means more than a weak stall.
- Accept invalidation quickly if price slices through the area with conviction.
The best foundation in technical analysis for traders is boring on purpose. Read price. Respect trend. Mark real decision zones. Everything else sits on top of that.
How to Read a Price Chart Like a Pro
Reading a chart well isn't about spotting fancy patterns. It's about understanding what each candle says about pressure, failed pressure, and who lost control.
A candlestick gives you four pieces of information: open, high, low, and close. The body shows where price opened and closed. The wick shows rejection. Long upper wicks often show sellers pushed back after an attempted move higher. Long lower wicks often show buyers did the same below.
Candles tell a story, not a signal by themselves
One candle rarely means much in isolation. Context gives it meaning.
A rejection candle at random in the middle of a range is noise. A rejection candle at a higher-timeframe resistance zone after an extended move is information. That's the difference between chart reading and candle collecting.
Use candle reading this way:
- At support: Look for failed pushes lower and closes back into the range.
- At resistance: Look for failed pushes higher and closes back under the area.
- After breakout attempts: Check whether the candle closed with conviction or left a long wick showing rejection.
Use multiple timeframes to avoid tunnel vision
A junior trader often stares at one timeframe and forces a trade. A better habit is to build context from top down.
A simple workflow works well:
- Daily chart: Define the broader direction and major zones.
- H4 chart: Find the active swing and see whether momentum supports that direction.
- H1 chart: Look for the actual execution setup.
If the daily is pressing into resistance, the H4 is stalling, and the H1 gives you a clean reversal trigger, that's useful alignment. If the daily is trending up and you're shorting a tiny H1 pullback, you're fighting a bigger flow.
The lower timeframe gives the entry. The higher timeframe decides whether the trade deserves your risk.
Volume and volatility separate real moves from fake ones
Price can break a level and still fail hard. That's why confirmation matters.
For active traders, setups with 3 to 5 aligning indicators such as trend, momentum, and volume confirmation are significantly more successful than setups confirmed by only 1 or 2 indicators, according to OANDA's introduction to technical analysis and chart-based trade confirmation. The same source notes that traders should watch for Bollinger Band squeezes, where low volatility can signal a coming breakout.
Here's how to use that in practice:
| What you see | What it may mean | Better response |
|---|---|---|
| Breakout with weak follow-through | Level may not be truly broken | Wait for retest or stand aside |
| Tight volatility before expansion | Market is compressing | Prepare, don't predict |
| Trend, momentum, and volume all agree | Cleaner directional case | Consider a planned entry |
| Only one indicator fires | Noise is more likely | Pass the trade |
The mistake is thinking every chart needs a trade. It doesn't. A clean read often ends with “not today,” and that's a professional decision.
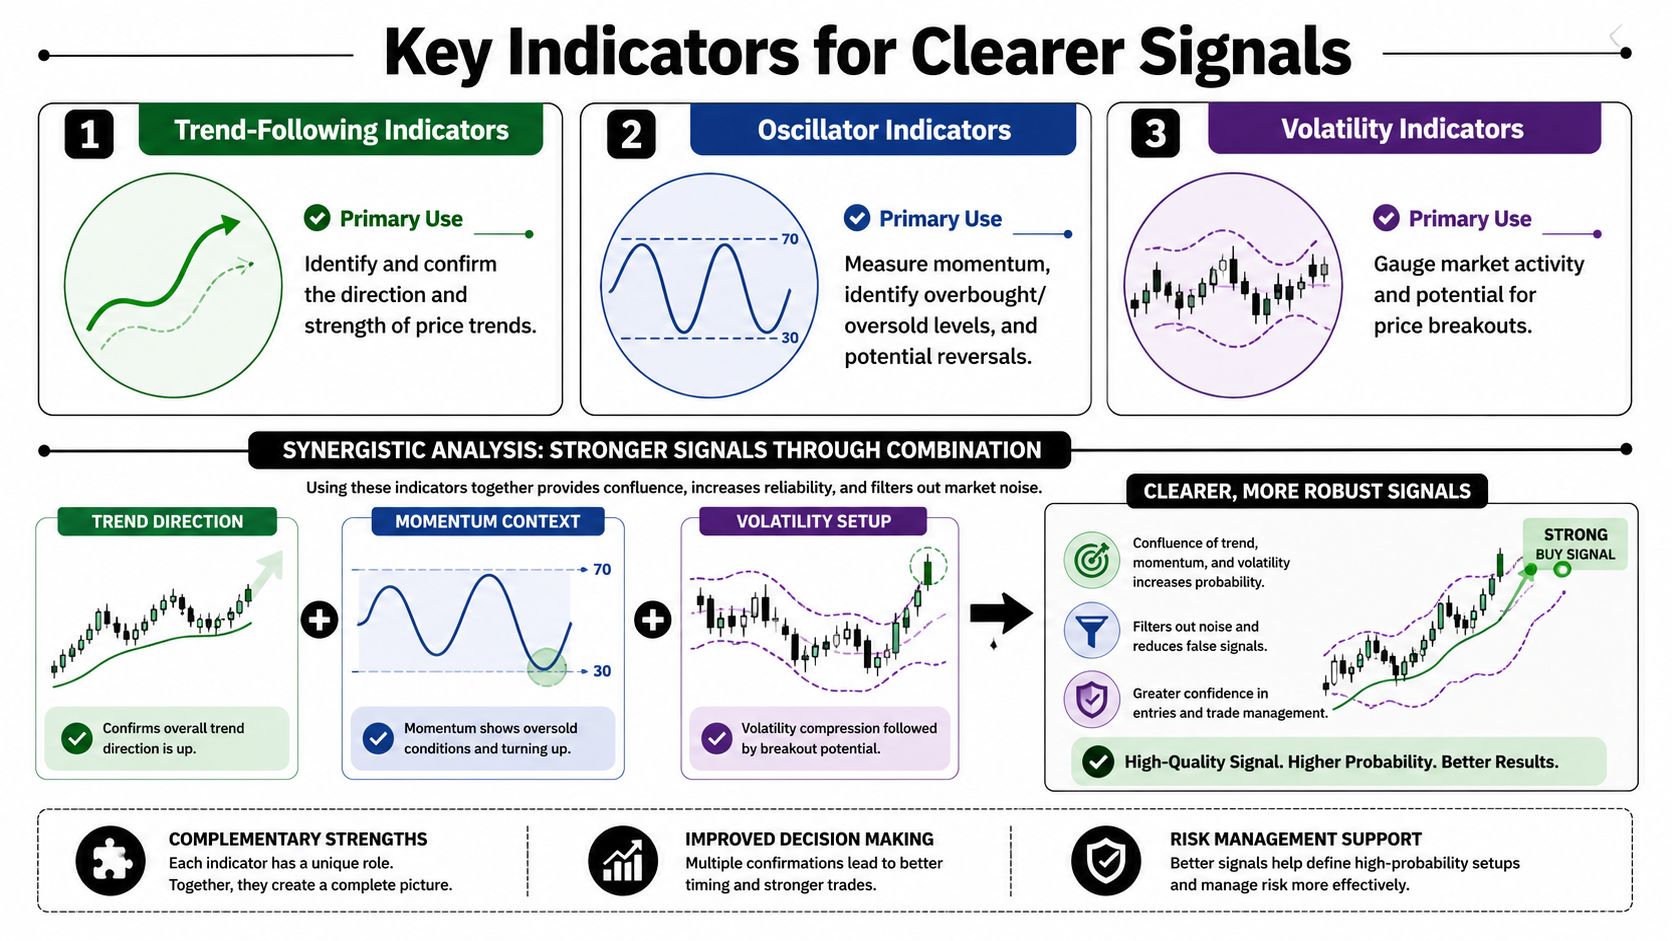
Applying Key Indicators for Clearer Signals
Indicators help when they answer a specific question. They hurt when traders pile them on because empty charts feel uncomfortable.
I group indicators into three jobs. Trend, momentum, and volatility. If you know which job each tool does, you stop asking a trend indicator to time reversals and stop asking an oscillator to define the larger market direction.
Moving averages for trend direction
Moving averages are useful because they force you to stop arguing with the tape. They smooth noise and show whether price is broadly expanding or contracting around a directional bias.
One of the best-known long-term signals is the 50-day and 200-day SMA crossover. The Golden Cross happens when the 50-day rises above the 200-day. The Death Cross happens when it drops below. These crossovers correlate with a 65 to 70% probability of sustained directional momentum over the next 6 to 12 months across major equity indices and forex pairs.
That doesn't mean every crossover should be traded blindly. It means the signal deserves respect as a trend benchmark.
A practical use case:
- If the higher timeframe has a Golden Cross, avoid forcing aggressive countertrend shorts.
- If a Death Cross is in play, treat rallies as suspect until price proves otherwise.
- If the crossover is fresh, give price room to confirm instead of chasing the first move.
If you want to build cleaner chart routines around these tools, a focused guide on the moving average indicator is worth reviewing.
RSI for exhaustion and divergence
A lot of traders misuse RSI by treating overbought as “must short” and oversold as “must buy.” That's not how strong trends behave.
The stronger use of RSI is divergence. RSI runs from 0 to 100. Readings above 70 are often labeled overbought, and readings below 30 are labeled oversold. More important, when price makes a higher high while RSI makes a lower high, that bearish divergence signals a 75 to 80% probability of an imminent correction. The same principle applies in reverse for bullish divergence. The verified data also notes that RSI divergence can precede price action by 2 to 4 trading sessions, which is why experienced traders watch it as an early warning, not a stand-alone trigger.
That gives you a useful edge in challenge conditions. You don't need to catch the exact turning point. You need to notice when momentum no longer supports your risk.
When RSI diverges and structure starts to fail, stop searching for reasons to stay in the trade.
MACD and Bollinger Bands for confirmation
MACD is useful because it shows momentum shifts in a way most traders can read quickly. The classic construction uses the 12-period EMA and 26-period EMA, with the signal line commonly based on the 9-day EMA of the MACD line. Crosses can help confirm direction changes, especially when they agree with price structure.
Bollinger Bands answer a different question. They use a 20-day SMA with two standard deviations to show relative volatility. Bands contract when volatility compresses and expand when it picks up. That's why they work well before breakout periods and why they're dangerous if you interpret every touch of an outer band as an immediate reversal.
Confluence beats indicator stacking
Most retail traders overcomplicate charts and still miss the point. Confluence isn't about having more tools. It's about having tools that answer different questions and point in the same direction.
A clean confluence model might look like this:
| Indicator group | Question it answers | Example use |
|---|---|---|
| Moving averages | Is the market broadly trending | Stay with higher-timeframe direction |
| RSI | Is momentum weakening or overstretched | Spot divergence before chasing |
| MACD | Is momentum shifting | Confirm acceleration or slowdown |
| Bollinger Bands | Is volatility contracting or expanding | Prepare for breakout or avoid noisy conditions |
That's enough. If you need six more indicators to feel safe, the problem usually isn't the chart. It's conviction without evidence.
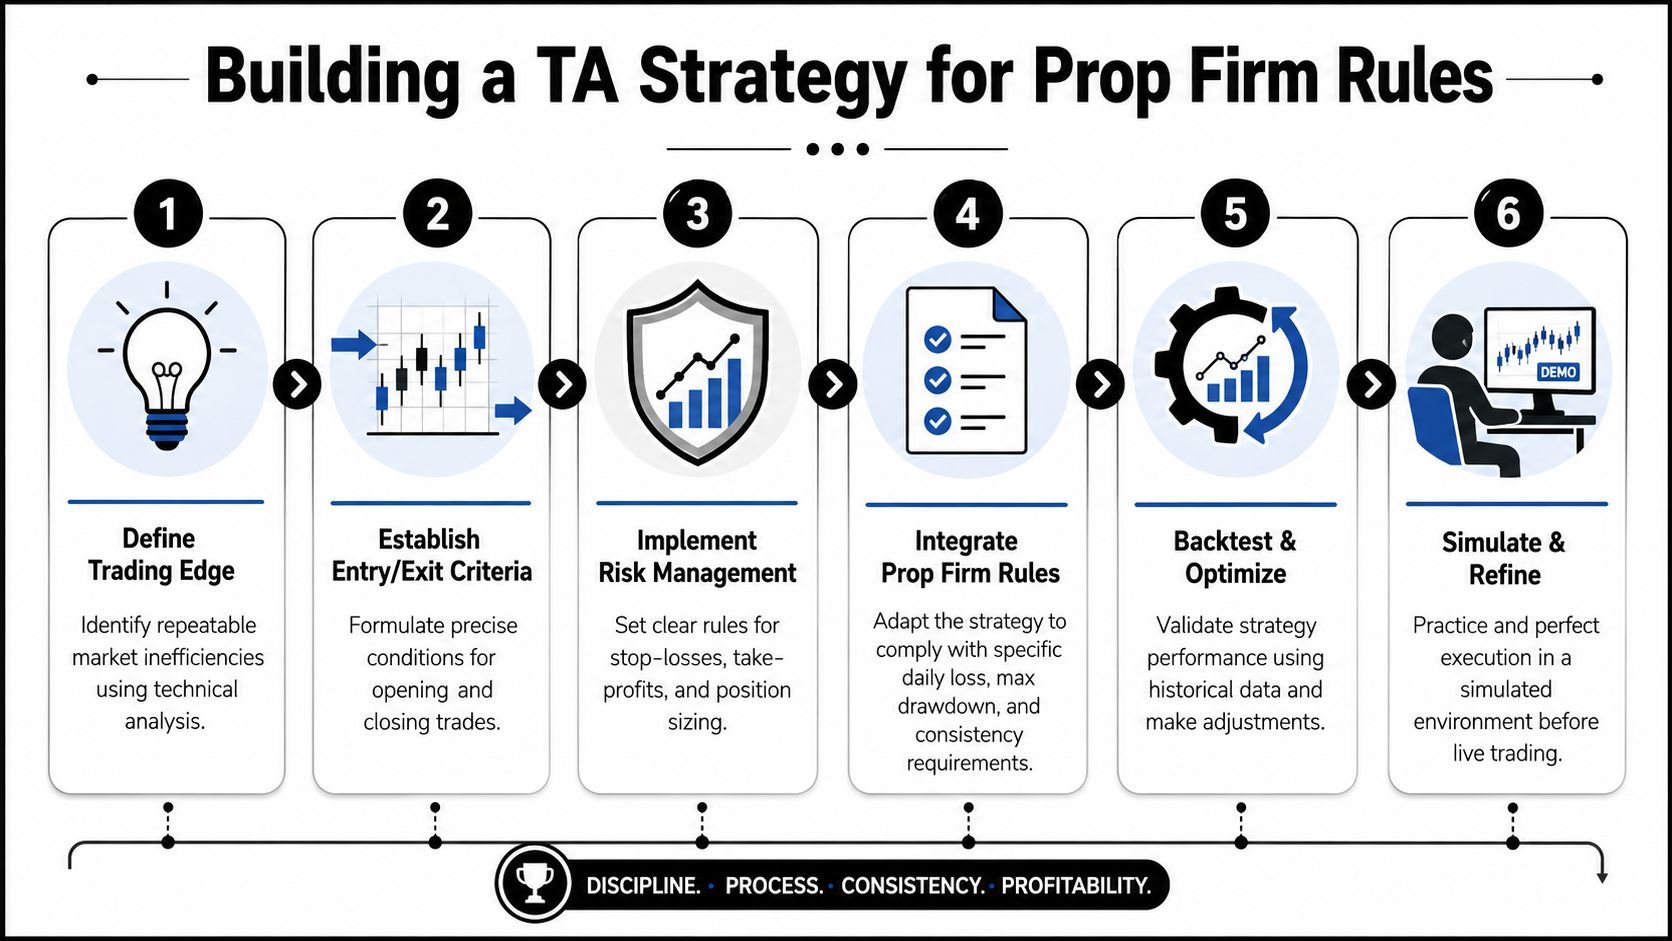
Building a TA Strategy for Prop Firm Rules
A strategy that works in a personal account can fail inside a challenge because the rules punish sloppy execution faster than the market does. That's where many traders get exposed.
Data from a 2025 study by the Journal of Financial Trading found that 78% of funded trader failures in challenges were driven not by lack of market skill, but by risk-of-ruin mismanagement under rigid rules such as a 5% daily loss cap, a blind spot that general TA content rarely addresses, as cited in this discussion of challenge risk constraints.
Your strategy must fit the rule set
That means every trade plan has to answer two questions before you click buy or sell:
- Where is the setup invalid if I'm wrong
- What does that loss mean relative to my challenge limits
Most traders answer the first question loosely and ignore the second completely. That's why they can be directionally right over a week and still fail in two bad sessions.
A prop-friendly strategy needs these parts:
- Entry trigger: A specific event, not a feeling. For example, price retests a marked level while momentum confirms.
- Stop-loss placement: Based on market structure, not a random number of points.
- Profit target: Chosen before entry.
- Position size: Adjusted to fit the stop distance and account rules.
- Session filter: A reason to trade this time of day and avoid another.
- No-trade condition: A rule that keeps you out during noise.
Build around one repeatable setup
You don't need five setups to pass a challenge. You need one setup you can execute without improvising under stress.
Here's a practical framework:
Higher-timeframe trend plus lower-timeframe trigger
Start by defining the directional bias on the higher timeframe. Then use a lower timeframe to find the actual entry.
For example:
- Higher timeframe trend points up.
- Price pulls back into support.
- Momentum stabilizes instead of collapsing.
- Lower timeframe confirms rejection and reclaim.
- Stop goes beyond the invalidation point, not where it “feels safe.”
That's disciplined technical analysis for traders. It links structure, timing, and risk in one workflow.
Risk-to-reward has to survive the rules
A challenge trader can't think only in win rate. The account rules force you to care about trade quality and damage control.
A simple checklist helps:
| Before entry | Question |
|---|---|
| Bias | Am I trading with or against the higher-timeframe structure |
| Location | Is price at a meaningful zone or in the middle of nowhere |
| Confirmation | Do I have real confluence or one weak signal |
| Invalidation | Where is the trade clearly wrong |
| Account impact | If stopped, does this keep me comfortably within limits |
Good challenge trading often feels conservative. That's exactly why it lasts.
What usually fails under prop conditions
The market doesn't have to beat you. Your own behavior usually does.
Common breakdowns include:
- Oversizing after a loss: Traders try to recover quickly and run straight into the daily cap.
- Taking B-grade setups: One early loser creates urgency, and standards collapse.
- Ignoring volatility conditions: Entries during messy expansion often get tagged out before the main move starts.
- Moving stops wider: Traders avoid being wrong and convert planned losses into account damage.
The best adjustment for prop rules is to make your strategy narrower, not broader. Fewer setups. Cleaner conditions. Smaller room for improvisation.
Backtesting Your Strategy on cTrader and DXtrade
A strategy isn't real because it sounds logical. It becomes real after you test it the same way you plan to trade it.
That means backtesting rules, not memories. You're checking whether your setup appears often enough, whether it survives different market conditions, and whether your execution rules make sense on the platform you'll use.

Manual backtesting still matters
Even if you plan to automate later, manual review teaches pattern recognition in a way raw metrics don't.
Use this process:
- Pick one setup only. Don't test three ideas at once.
- Choose one market and timeframe. Keep the environment stable.
- Scroll back far enough that you can't remember the move.
- Move candle by candle and mark where your rules would trigger.
- Log each trade with entry, stop, target, context, and any reason to skip.
- Review execution errors separately from setup quality.
A written journal matters here. If a setup loses but followed your rules, that's acceptable. If a setup wins and broke your rules, that's still a mistake.
For traders who want a structured framework, this guide on how to backtest trading strategies is a useful reference point.
Using cTrader and DXtrade effectively
cTrader works well for traders who want cleaner charting, replay-style review, and cBot support. DXtrade is practical for traders who want straightforward execution and fast access to challenge-style workflows.
Whichever you use, focus on consistency:
- Template your chart layout: Same colors, same indicators, same timeframes.
- Save your watchlist: Don't waste energy rebuilding routine.
- Tag setup types: Track which conditions produce your best trades.
- Review time-of-day behavior: Some setups degrade badly outside your preferred sessions.
Algorithmic filters need human judgment
Automation helps with execution discipline. It also creates a different kind of danger. A 2024 report from the International Association of Quantitative Traders says 65% of algorithmic traders fail prop challenges because their EAs overcommit capital and ignore the discretionary technical filters that human traders use to pause trading, as discussed in this article on technical analysis strategies and hybrid execution.
That matters if you're building an EA or cBot around technical analysis for traders. Coding the entry is the easy part. Coding the “don't trade this market condition” logic is harder and more important.
Examples of useful filters:
| Filter type | What it does |
|---|---|
| RSI divergence filter | Blocks entries when momentum disagrees with price |
| Volatility filter | Avoids low-quality conditions during compression or erratic expansion |
| Session filter | Restricts execution to your tested market hours |
| Structure filter | Prevents trades in the middle of range noise |
When you review automated logic, think the same way good operators review business systems. They don't ask only whether the process runs. They ask whether the process produces a worthwhile return after constraints, friction, and mistakes. If you want a simple example of that kind of thinking outside trading, See the return from specialized AI experts and notice how structured inputs produce clearer decision-making.
Backtesting doesn't prove the future. It proves whether your rules are coherent enough to deserve live risk.
Critical Risk Management and Avoiding Common Mistakes
Risk management matters more than any indicator you'll ever use. A great setup with bad discipline still fails. A decent setup with strong discipline can survive long enough to matter.
The hardest lesson for challenge traders is this: you can read the market correctly and still lose the account. If you enter late, size too big, move your stop, or revenge trade after a loser, the analysis becomes irrelevant.
The mistakes that usually break traders
Most failures aren't technical. They're behavioral.
- Revenge trading: You take a loss, feel the urge to get it back, and force the next trade.
- FOMO entries: Price starts moving without you, so you chase a bad location.
- Stop-loss drift: You widen the stop because admitting the setup failed feels worse than taking the hit.
- Signal shopping: You keep adding indicators until one says yes.
Those habits wreck challenge accounts because rule-based environments don't forgive emotional spikes.
A stop-loss is part of the trade plan, not an insult to your analysis.
A discipline checklist worth following
Use this before every session:
- Check your mental state: If you're angry, tired, or trying to recover yesterday's mistake, reduce risk or don't trade.
- Know your invalidation: Every setup needs a clear level where you're wrong.
- Predefine your maximum damage: Decide when the day is done before the day gets emotional.
- Grade the setup objectively: If it's not your A setup, pass.
- Record execution quality: Separate bad luck from bad behavior.
A lot of traders think discipline means becoming emotionless. It doesn't. It means building rules that stop emotion from controlling your position size and decision speed.
Technical analysis for traders works best when risk management acts like a gatekeeper. If the trade breaks the rules, it doesn't matter how good the chart looks.
Frequently Asked Questions About Technical Analysis
Is technical analysis better than fundamental analysis
They do different jobs. Technical analysis helps with timing, structure, momentum, and trade management. Fundamental analysis helps with broader valuation and macro context. For active traders, technical analysis is usually more actionable because entries and exits need clear price-based rules.
Can technical analysis predict the market with certainty
No. It works in probabilities, not certainty. That's why disciplined traders focus on setups, invalidation, and account protection instead of trying to be right on every trade.
What's the most profitable indicator
There isn't one. A single indicator used in isolation usually creates weak decisions. What tends to work better is confluence. Trend, momentum, and volatility tools each answer a different question. Combined properly, they filter noise better than any stand-alone signal.
Does technical analysis work for forex, crypto, and indices
Yes, but the application changes. Forex often rewards clean structure and session awareness. Crypto can move harder and punish loose stops. Indices can respect trend tools well but still become unstable around major events. The method stays the same. The execution has to fit the instrument's behavior and your risk limits.
Trading involves risk of loss. This article is educational only and not financial advice. If you want to test your process in a rule-based environment, review the funding options at MyFundedCapital and compare which challenge or instant funding route best fits your strategy, platform preference, and risk style.
MyFundedCapital gives disciplined traders a place to apply structured technical analysis under clear rules. If you want to compare challenge models, review account types, or start a funding evaluation, explore the MyFundedCapital funding programs.