

 AR
AR
 NL
NL
 EN
EN
 FR
FR
 DE
DE
 ES
ES
 IT
IT
 PL
PL
 SV
SV


Spotting a T-shaped candle on your charts after a downtrend can feel like finding a clue. This is the Dragonfly Doji, and it tells a powerful story about a battle between buyers and sellers that often signals a potential change in direction. This guide will teach you how to identify this pattern, understand the psychology behind it, and build a practical trading plan around it.

What Is a Dragonfly Doji Candlestick?
The Dragonfly Doji is a single-candle pattern that signals potential bullish reversal. It indicates that sellers pushed the price down significantly during the session, but buyers stepped in with overwhelming force, driving the price all the way back up to the opening level.
The pattern’s story is one of sharp rejection. Imagine a tug-of-war where the sellers almost win, only for the buyers to make a dramatic comeback and pull the rope back to the starting point.
The Anatomy of a Dragonfly Doji
To be a true Dragonfly Doji, a candlestick must have these specific features:
- Open, High, and Close Are Nearly Identical: The candle opens, reaches its high point, and closes at or very near the same price. This creates a tiny or non-existent body at the top of the trading range.
- Long Lower Wick: This is the long "tail" of the candle. It represents the price journey downwards before buyers took over.
- No Upper Wick: A perfect Dragonfly Doji has no shadow above its body, meaning the price never traded above its opening price.
The long lower wick is the most important feature. It’s the visual evidence of buying pressure rejecting lower prices.
The Psychology Behind the Pattern
When a Dragonfly Doji forms, you're seeing a shift in market psychology.
- Bears Are in Control: At the start of the session, selling pressure is strong, pushing the price down and forming the long lower wick.
- Bulls See an Opportunity: Buyers view these low prices as a bargain. They enter the market, absorbing all the selling pressure.
- A Decisive Reversal: The buying pressure is so intense that it pushes the price all the way back up to the opening level by the time the candle closes.
This counter-attack suggests that the downtrend is losing momentum. The sellers have been overpowered, signaling that the bulls might be ready to take control. For more on its relatives, check our guide on what a Doji candle is.
How to Read a Dragonfly Doji in Context
A Dragonfly Doji on its own is just a pattern; its location on the chart gives it meaning. To trade it effectively, you must analyze the context. Where it appears tells you whether it's a signal to act on or a warning to heed.
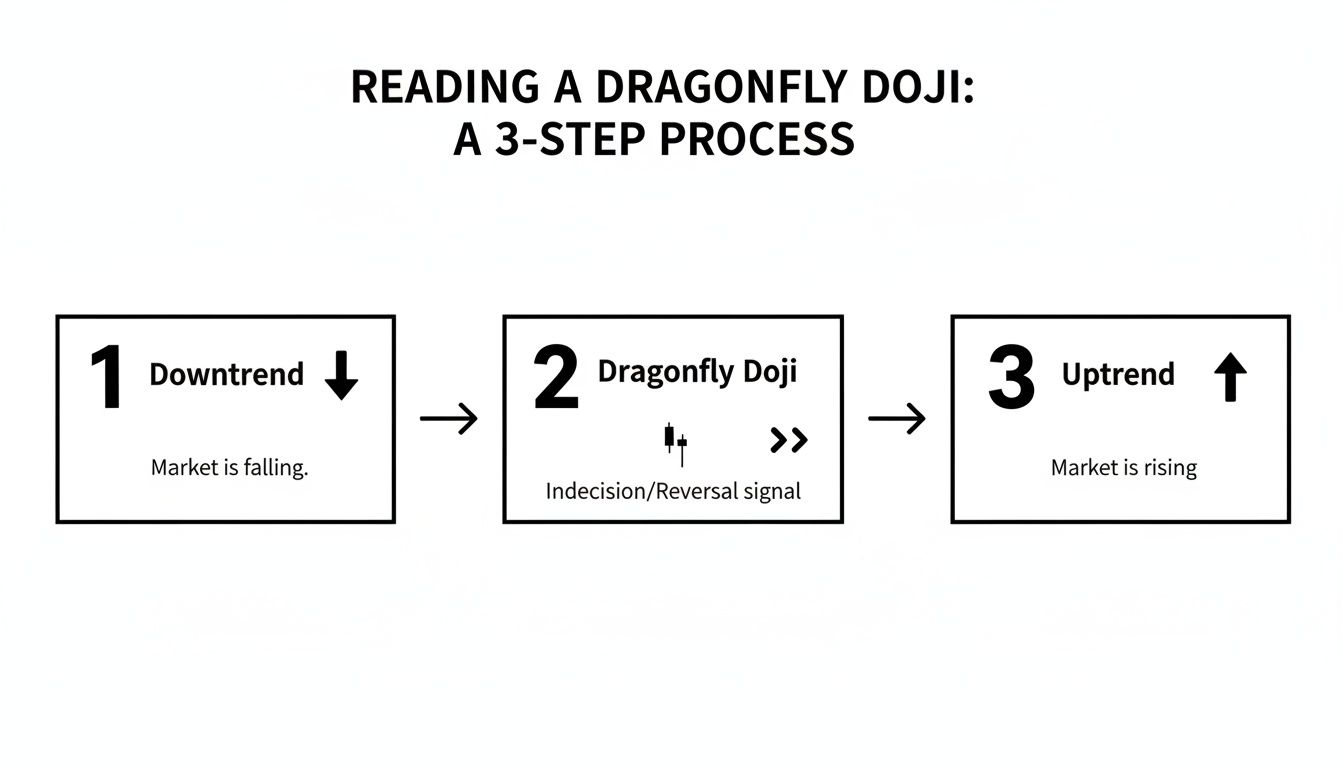
The Classic Signal: A Dragonfly Doji in a Downtrend
This is the textbook setup. When a Dragonfly Doji appears after a prolonged price decline, it’s a strong signal of a potential bullish reversal.
- The Story: Sellers have been in control. They try one last push down (the long lower wick), but they fail. Buyers step in with overwhelming force, driving the price back to its open.
- What It Means: This suggests seller exhaustion. The downward momentum may be stalling, and a bottom could be forming.
- Example: Imagine EUR/USD has fallen 300 pips over several days. A Dragonfly Doji forms on the daily chart right at a key support level of 1.0500. This is a high-probability clue that a bounce or reversal could be imminent.
The Warning Sign: A Dragonfly Doji in an Uptrend
Seeing this pattern during a strong uptrend is not a confirmation to buy more. Instead, it’s a warning sign.
- The Story: Although buyers ultimately defended the session’s low, the fact that sellers had enough power to create a significant dip in the first place is notable.
- What It Means: It suggests the bullish momentum might be weakening. It’s not an immediate sell signal, but it’s a reason to be cautious.
- Actionable Step: If you have a long position, this is a good time to consider tightening your stop-loss or taking partial profits.
The Confirmation Tool: A Dragonfly Doji in a Ranging Market
In a sideways or ranging market, a Dragonfly Doji can be an excellent confirmation tool.
- The Story: When the price is bouncing between clear support and resistance levels, a Dragonfly Doji at the support level reinforces its strength.
- What It Means: It visually confirms that buyers are actively defending that price floor, just as expected.
- Actionable Step: For range traders, this is a potential signal to enter a long position, targeting a move back up toward the top of the range (resistance).
How to Trade the Dragonfly Doji: A Practical 3-Step Guide
Identifying the pattern is the first step. Turning that observation into a disciplined trade with a positive expectancy requires a clear plan. Never trade a pattern without defining your entry, exit, and risk management rules first.
Step 1: Confirm Your Entry
A common mistake is entering a trade the moment the Dragonfly Doji closes. The pattern signals indecision that resolved in the buyers' favor for that session, but it doesn't guarantee the next move will be up. You need confirmation.
- The Rule: Wait for the next candle to close above the high of the Dragonfly Doji.
- The Logic: This proves that buyers have follow-through momentum and are strong enough to push the price past the recent high. Trading the reaction to the doji, not the doji itself, filters out many false signals.
Step 2: Set Your Stop-Loss
Your stop-loss protects your capital if the trade goes against you. The Dragonfly Doji provides a clear, logical level for your stop.
- The Rule: Place your stop-loss just below the low of the Dragonfly Doji's wick.
- The Logic: That low represents the exact price where buyers stepped in. If the price breaks below that level, the bullish thesis is invalid, and it’s time to exit with a small, managed loss.
Step 3: Plan Your Profit Targets
Knowing when to take profit is just as important as knowing when to enter. Here are two practical methods:
- Risk/Reward Ratio: Aim for a minimum 1:2 risk/reward ratio. If your stop-loss is 40 pips away from your entry, your first profit target should be at least 80 pips away. This ensures your winning trades are significantly larger than your losing ones.
- Key Resistance Levels: Look left on your chart for previous areas of resistance. These could be old swing highs, a major moving average (like the 50 or 200 SMA), or a significant Fibonacci level. These are natural places where sellers may reappear, making them smart levels to take profit.
To further increase your odds, look for confluence, where multiple signals align. A Dragonfly Doji is much more powerful if it occurs with high volume, at a major support level, or alongside a bullish indicator signal like RSI divergence. You can learn more in our guide to price action trading strategies.

Common Mistakes to Avoid
The Dragonfly Doji is a useful tool, but several common mistakes can turn a good signal into a bad trade. Being aware of these pitfalls is crucial.
- Ignoring the Broader Trend: Trading a bullish Dragonfly Doji on a 15-minute chart when the daily and weekly charts are in a strong downtrend is a low-probability trade. Always trade in alignment with the higher timeframe trend.
- Trading Without Confirmation: As mentioned, jumping into a trade immediately after the doji forms is gambling. Wait for the market to confirm the buyers are still in control.
- Mismanaging Risk: Setting your stop-loss too tight will get you stopped out by normal market noise. Setting it too wide ruins your risk/reward ratio. Stick to the logical level: just below the doji’s low.
- Forgetting About Volume: A Dragonfly Doji on high volume is a sign of strong conviction. A doji on low volume is far less significant and more likely to be random noise.
Always remember that trading involves substantial risk of loss and is not suitable for every investor. The content here is for educational purposes only and is not financial advice.
FAQ: Dragonfly Doji Candlestick
What’s the difference between a Dragonfly Doji and a Gravestone Doji?
They are opposites. A Dragonfly Doji is T-shaped and signals a potential bullish reversal after a downtrend. A Gravestone Doji is an inverted T and signals a potential bearish reversal after an uptrend.
Is the Dragonfly Doji a reliable pattern?
Its reliability depends heavily on context. A Dragonfly Doji is most reliable when it appears after a significant downtrend, at a key support level, and on high trading volume. No pattern is 100% reliable; it's a tool for assessing probability, not a guarantee.
Can I trade the Dragonfly Doji on any timeframe?
You can, but the pattern is significantly more reliable on higher timeframes like the daily, weekly, or 4-hour charts. On lower timeframes (e.g., 1-minute or 5-minute), the pattern is more susceptible to market noise and false signals.
What happens if the price breaks below the Dragonfly Doji's low?
A break below the low of the Dragonfly Doji invalidates the bullish signal. In fact, this can be seen as a bearish signal in itself, as it shows that buyers tried to defend a level but ultimately failed, indicating strong selling pressure.
Now that you understand how to identify and trade the dragonfly doji candlestick, the next step is to apply this knowledge with discipline. A clear trading plan built around this pattern, with its defined risk parameters, is ideal for the structured environment of a proprietary trading firm.
Ready to prove your skills? Explore the funding programs at MyFundedCapital. Our challenges are designed for traders like you who use clear, systematic strategies to manage risk and deliver results.
