Staring at a stock chart that's moving sideways can be confusing, but sometimes this indecision is actually signaling a powerful move ahead. Learning to spot wedge pattern stocks helps you understand this coiled energy and anticipate a breakout. This guide will teach you how to identify, analyze, and trade rising and falling wedges with a clear, step-by-step plan.

What Is a Wedge Pattern?
A wedge is a chart pattern defined by two converging trendlines that frame the price action. One line connects the recent highs, and the other connects the recent lows. As these lines squeeze the price into a tighter range, they signal that volatility is decreasing and a breakout is likely approaching.
This pattern captures a period of consolidation where either buyers or sellers are slowly losing momentum. It's a visual representation of a trend becoming exhausted, offering a clue about the market's next potential move. Recognizing this shift before it becomes obvious is a key skill for any trader.
The Anatomy of a Wedge
To confidently identify a wedge, look for these key components:
- Converging Trendlines: This is the most obvious feature. Two trendlines framing the price are clearly angled toward each other, creating the wedge shape.
- Declining Volume: As the price range tightens, trading volume should ideally fade. This drop shows that the conviction behind the prior trend is weakening.
- At Least Five Touches: For a wedge to be considered valid, the price should test the trendlines multiple times. A reliable pattern has at least three touches on one line and two touches on the other.
When these elements align, you're seeing a genuine struggle for control. The shrinking volume confirms the trend is running out of steam, creating a setup for a potential reversal or continuation. While wedges are just one of many formations, understanding them is a major step. You can see how they fit into the bigger picture by learning about other powerful chart patterns.
Wedges come in two main types, each telling a different story.
Rising vs. Falling Wedge At a Glance
This table breaks down the key differences between the two main types of wedge patterns.
| Characteristic | Rising Wedge | Falling Wedge |
|---|---|---|
| Appearance | Price is squeezed into an upward-slanting channel. | Price is squeezed into a downward-slanting channel. |
| Psychology | Shows waning buying pressure and exhaustion in an uptrend. | Shows waning selling pressure and exhaustion in a downtrend. |
| Volume Trend | Typically diminishes as the pattern develops. | Typically diminishes as the pattern develops. |
| Typical Outcome | Bearish Reversal | Bullish Reversal |
| Breakout Direction | Downside | Upside |
How to Trade a Rising Wedge Pattern
The rising wedge is a classic bearish pattern that often warns of an uptrend losing steam. Spotting one can help you protect profits or even plan a short trade before a potential reversal.
The pattern shows that while buyers are still pushing the price to new highs, each push is weaker than the last. Think of it like pushing a ball up a narrowing ramp; momentum slows until the ball gets stuck and rolls back down.

Checklist for Identifying a Rising Wedge
Use this practical checklist to validate a rising wedge on a stock chart:
- Two Upward-Sloping Trendlines: Both the lower support line (connecting swing lows) and the upper resistance line (connecting swing highs) must be angled upward.
- Converging Lines: The lower support line must be steeper than the upper resistance line. This creates the signature "wedging" or tightening price action.
- Declining Volume: As the price grinds higher inside the wedge, trading volume should be tapering off. This signals that buying pressure is drying up.
- Multiple Touches: Look for at least five touches in total (e.g., three on one line and two on the other) before the price breaks out.
The psychology behind a rising wedge is pure exhaustion. Buyers are still technically in charge, but the fact that new highs are being made on less and less volume is a huge red flag. Studies on the historical performance of rising wedges on ainvest.com show a high probability of bearish breakdown, making it a pattern worth respecting. For a deeper analysis, check out our complete guide on the rising wedge pattern.
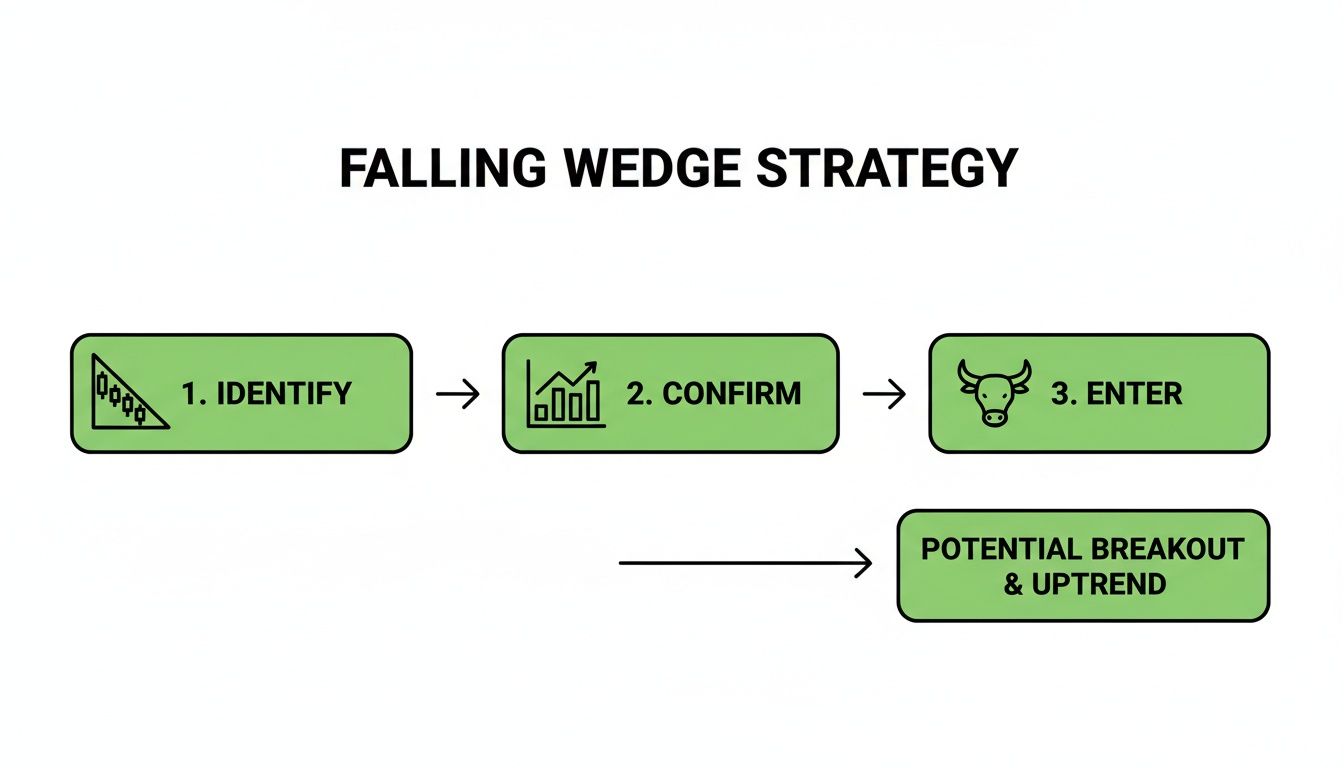
How to Trade a Falling Wedge Pattern
While its cousin, the rising wedge, signals caution, the falling wedge often presents a bullish opportunity. This pattern frequently appears after a stock has been in a downtrend and suggests that selling pressure is finally running out of gas.
Think of it as a spring being coiled tighter. As sellers push the price down, each push has less force. The price gets squeezed, building potential energy for a powerful upward breakout.
Checklist for Identifying a Falling Wedge
To ensure you're looking at a valid setup, run through this simple checklist:
- Established Downtrend: The pattern is most effective when it forms after a clear, sustained price drop.
- Two Downward-Sloping Trendlines: Both the upper resistance line (connecting lower highs) and the lower support line (connecting lower lows) must be angled down.
- Converging Trendlines: The upper resistance line needs to be steeper than the lower support line. This shows that sellers are losing momentum faster than buyers are giving up.
- Diminishing Volume: As the price consolidates inside the wedge, trading volume should noticeably dry up. This is a strong sign that the sellers who were driving the downtrend are getting tired.
The falling wedge shows us the market's mindset shifting. As sellers become less aggressive, opportunistic buyers start to step in. When the price finally breaks through the upper resistance trendline, it signals that buyers have taken control. Data on the statistical strength of wedges on luxalgo.com reinforces its reliability as a bullish reversal signal.
A Step-by-Step Guide to Trading Wedge Patterns
Spotting a wedge is one thing; trading it requires a disciplined plan. A clear, repeatable process helps you manage risk and prevents emotional decisions from impacting your trades. No strategy guarantees profits, but a structured approach improves your odds.
Step 1: The Entry Trigger (Wait for Confirmation)
Patience is critical. A common mistake is entering a trade before the pattern is confirmed. A wedge is only a potential setup until the price actually breaks out.
- Rule of Thumb: A valid breakout occurs when a full candle closes decisively outside the pattern's trendline.
- Falling Wedge (Bullish): A close above the upper resistance line.
- Rising Wedge (Bearish): A close below the lower support line.
- Volume Confirmation: An ideal breakout is accompanied by a noticeable spike in volume, which signals conviction behind the move.
Step 2: Setting Your Stop-Loss for Capital Protection
Your stop-loss is your non-negotiable exit plan if the trade goes against you. It protects your capital from significant losses.
- For a Falling Wedge (Bullish): Place your stop-loss just below the last swing low inside the wedge. If the price breaks out but then falls below this low, the bullish setup is invalidated.
- For a Rising Wedge (Bearish): Place your stop-loss just above the last swing high within the wedge. If the price breaks down but then rallies back above that peak, the bearish case is no longer valid.
This method uses the pattern's structure to define your risk, rather than an arbitrary percentage.
Step 3: Calculating Your Take-Profit Target
Once you're in a trade, you need a logical exit point to take profits. The most common method for wedge pattern stocks is the measured move.
- Measure the Height: Calculate the price distance between the upper and lower trendlines at the widest point of the wedge (the "base").
- Project from the Breakout: Take that measured distance and either add it to the breakout point (for a bullish falling wedge) or subtract it from the breakout point (for a bearish rising wedge).
A textbook example of this occurred on the Vanguard Financials ETF (VFH). After forming a rising wedge from $88.83 to a high of $90.87, it broke support and plunged to $74.09, hitting a price target derived from the wedge's height for an 18.5% drop. You can see the full analysis of how this textbook trade unfolded on chartswatcher.com. This technique provides a data-driven profit objective.
How Prop Firm Traders Use Wedge Patterns
As a funded trader, every trade must align with the firm's risk management rules. Wedges are excellent tools for prop firm traders because their structure provides clear entry, stop-loss, and target levels, which helps in adhering to rules like daily loss limits and maximum drawdown.
The primary job of a funded trader is risk management. Your goal is to ensure that even when a trade is wrong, the loss is small and manageable.
Aligning Trades with Prop Firm Risk Rules
Position sizing is a critical skill. Let's walk through an example. Imagine you're trading a $100,000 funded account with a 5% daily loss limit ($5,000). You decide to risk 1% of the account ($1,000) on any single trade.
Here’s how to calculate position size for a wedge breakout:
- Find the Setup: You identify a falling wedge on a stock chart.
- Define Your Risk: Your entry will be the close of the breakout candle, and your stop-loss will be below the last swing low inside the wedge. Let's say this distance is $2 per share.
- Calculate Position Size: Divide your maximum trade risk ($1,000) by your risk per share ($2).
- $1,000 / $2 per share = 500 shares.
By doing this math before you enter, your maximum potential loss is capped at $1,000 if the trade hits your stop. This controlled risk is essential for protecting a funded account.
Wedges as a Core Strategy for Passing Challenges
Prop firm challenges test your consistency and discipline. The goal is to hit a profit target without breaching drawdown rules. The statistical reliability of wedge patterns makes them ideal for this environment.
When you build a trading plan around high-probability setups like wedges, you are trading with a statistical edge. This methodical approach is what prop firms look for. Understanding how proprietary trading firms work will help you align your strategy with their expectations.
FAQ: Common Questions About Trading Wedge Patterns
Here are answers to some of the most common questions traders have about wedges. Remember, this content is for educational purposes only and is not financial advice. All trading involves significant risk of loss.
What's the main difference between a wedge and a triangle?
Both are consolidation patterns, but the key difference is the direction of the trendlines. In a wedge, both trendlines slope in the same direction (either up or down). In a triangle, one trendline is typically flat (horizontal) or the two lines slope in opposite directions toward each other. This distinction is critical, as a rising wedge is bearish, while an ascending triangle (flat top, rising bottom) is typically bullish.
How long does a wedge pattern take to form?
Wedges can form on any timeframe, from a 1-minute chart to a monthly chart. A good rule of thumb is that a reliable wedge usually takes between 10 to 50 price bars to develop. A wedge that forms over a longer period (e.g., several weeks on a daily chart) often leads to a more significant and sustained breakout than one that forms over a few hours on an intraday chart.
What should I do if a wedge pattern fails?
A pattern "fails" when it breaks out in the opposite direction of what's expected or reverses immediately after a breakout. No pattern is 100% accurate. This is precisely why a stop-loss is mandatory. If a pattern fails, your plan is simple: exit the trade at your pre-defined stop-loss. Do not hesitate or second-guess your plan. Accepting a small, managed loss is how you protect your capital to trade another day.
How can I practice trading wedge patterns without risking money?
The best way to build skill is through practice on a demo account or trading simulator.
- Identify: Go through historical charts on various stocks and timeframes to find past wedge patterns. Practice drawing the trendlines until it feels natural.
- Analyze & Plan: For each pattern, map out a hypothetical trade. Mark your entry, stop-loss, and take-profit target based on the rules in this guide.
- Review: Track the outcomes of your practice trades. Note what worked and what didn't. Consistent success in a simulated environment is a good indicator that you're ready to apply the strategy with real capital.
Ready to apply your knowledge in a real-world trading environment with structured risk management? At MyFundedCapital, we provide the platform and funding for talented traders to succeed.
Learn more about our funding programs and start your trading journey today!