
Are you tired of feeling like you're always on the wrong side of the market? Smart Money Concepts (SMC) offer a way to analyze price action by decoding the moves of large institutions. This guide will give you a practical, no-hype framework for understanding what SMC really is and how to use it to find high-probability trading setups.
Trading with Smart Money Concepts (SMC) isn't about finding a secret holy grail; it's a specific method for reading price action. It focuses on the why behind a market move, not just the what. Understanding this framework can help you make more informed decisions, but it's crucial to remember that all trading involves significant risk of loss and this content is educational only, not financial advice.
What Are Smart Money Concepts, Really?
Let's cut through the hype. Smart Money Concepts is an analytical framework designed to understand the logic behind sudden, sharp price moves that often seem to come from nowhere. The core idea is that large institutions—banks, hedge funds—can't just place massive orders without moving the price against themselves. To get their trades filled at a favorable price, they must strategically engineer price movements to build liquidity.
SMC provides a lens to spot these maneuvers. However, mastering it requires significant screen time, discipline, and realism. It's a skill, not a shortcut.
The Logic Behind Institutional Moves
The entire concept boils down to scale. If a bank wants to buy €10 billion of a currency, they can't simply click "buy." Doing so would cause the price to skyrocket, ruining their entry.
Instead, they accumulate their position strategically. A common tactic is to first push prices down, deliberately triggering the stop-loss orders of retail traders holding long positions. This rush of sell orders creates a pool of liquidity—the "fuel" they need to fill their massive buy orders at a better price. This is often called a "stop hunt" or "liquidity grab."
By learning to identify the signs of these actions, you can start to anticipate market direction. This hinges on understanding a few key building blocks:
- Market Structure: The overall trend or "map" of the market.
- Liquidity: Pools of orders that act as magnets for price.
- Order Blocks: Specific price zones showing the footprints of institutional orders.

The framework's focus on institutional order flow is why it's popular in highly liquid markets like forex and major indices.
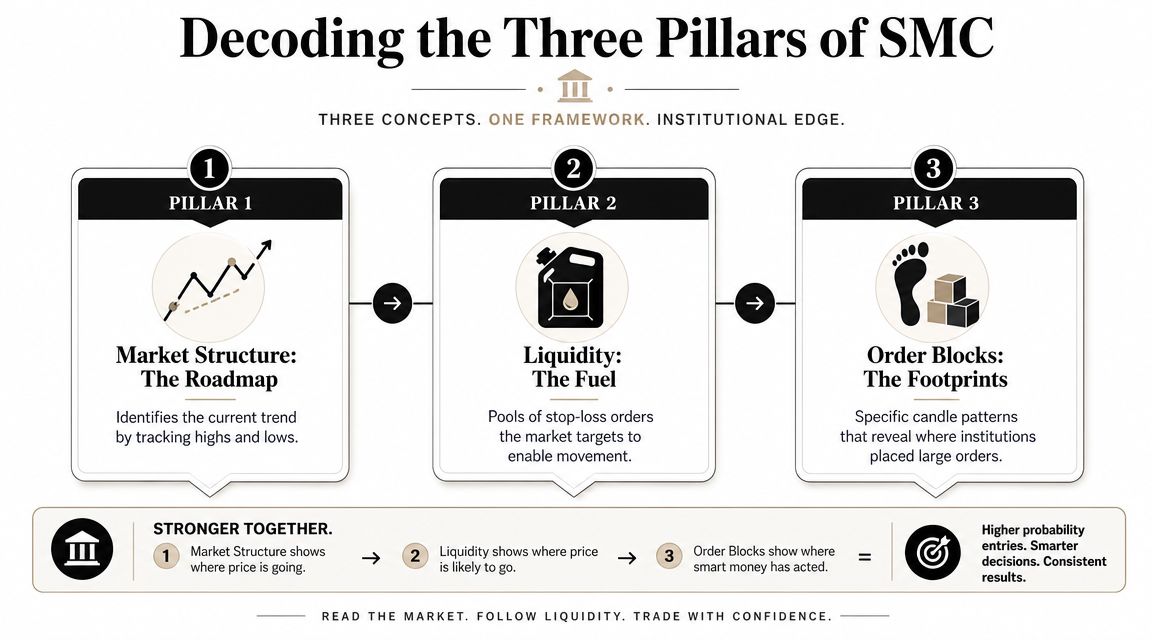
Decoding the Three Pillars of SMC
To trade with Smart Money Concepts, you must shift your perspective. Stop seeing charts as random lines and start reading them as a story of supply and demand written by the market's biggest players.
This story rests on three core pillars that work together:
- Market Structure: This is your map, showing the lay of the land.
- Liquidity: This is the fuel that moves the market from one point to another.
- Order Blocks: These are the footprints left by institutional money.
Understanding these three pillars is the first practical step toward applying SMC.
Pillar 1: Market Structure (The Roadmap)
Market structure is the absolute foundation. It provides the big-picture context, telling you if the market is trending up, down, or moving sideways. Trading without understanding structure is like driving without a map—you're likely to make wrong turns.
- In an uptrend, price makes a series of higher highs (HH) and higher lows (HL).
- In a downtrend, price forms a pattern of lower lows (LL) and lower highs (LH).
Actionable Advice: Trade with the flow, not against it. If the daily chart is in a clear uptrend, focus your efforts on finding buying opportunities.
Pillar 2: Liquidity (The Fuel)
Nothing in the market moves without a reason, and that reason is almost always liquidity. Think of liquidity as pools of buy and sell orders resting at specific price levels. Institutions need to find these pools to fill their massive positions without causing major price slippage.
Liquidity tends to accumulate in obvious places:
- Swing Highs and Lows: Many traders place stop-loss orders just above recent peaks or below recent troughs. These clusters create significant liquidity.
- Equal Highs and Lows: When price hits the same level multiple times and reverses, retail traders see "strong resistance" or "support." Smart money sees a giant neon sign flashing "LIQUIDITY HERE."
A "stop hunt" is a deliberate move by institutions to push price into one of these zones, trigger the stops, and use the resulting activity to fill their own orders before sending the market in the opposite direction.
Pillar 3: Order Blocks (The Footprints)
If liquidity is the fuel, then order blocks are the footprints showing where institutional players filled their tanks. An order block is a specific candle or price area that marks a significant injection of institutional buy or sell orders.
- A bullish order block is typically the last down-candle before a powerful upward move.
- A bearish order block is the last up-candle before a sharp downward move.
The theory is that institutions couldn't fill their entire position within that one candle. Price will often return to that zone—a process called "mitigation"—to pick up the remaining orders before the main move continues. For an SMC trader, these order blocks become high-probability areas for planning an entry.
To get a more granular view, you can study the underlying volume and orders. Our guide on order flow analysis is a great next step to see the market's pulse in real time.
A Practical Checklist for Finding SMC Setups
Knowing the theory is one thing; using it to pinpoint a high-probability setup on a live chart is another. It all comes down to a systematic, repeatable process. This isn’t about chasing every market wiggle but patiently waiting for key pieces of the puzzle to align.
Here is a step-by-step checklist to guide your analysis:
-
Define the Higher Timeframe (HTF) Narrative: Start on the daily or 4-hour chart. Is the market making higher highs and higher lows (bullish)? Or lower lows and lower highs (bearish)? This sets your directional bias. If the HTF is bullish, you should be looking for buys.
-
Mark Key Liquidity Zones: Identify the obvious swing highs and lows on your chart. These pools of buy-side and sell-side liquidity are magnets for price. The market is likely to move toward these zones to trigger stop orders.
-
Wait for a Liquidity Sweep: This requires patience. Sit and wait for the price to attack one of those liquidity zones. This is the "stop hunt" where institutions engineer liquidity to fill their orders.
-
Look for a Change in Structure (Confirmation): After the sweep, you need confirmation that it was a liquidity grab.
- A Break of Structure (BoS) confirms trend continuation. For example, in an uptrend, if price pulls back, sweeps a low, and then breaks a recent high, the uptrend is likely resuming.
- A Change of Character (CHoCH) signals a potential reversal. If price sweeps a major high and then breaks through the most recent swing low, it's a strong hint the trend might be flipping from bullish to bearish.
-
Pinpoint a Refined Entry: Once you get confirmation (BoS or CHoCH), zoom in to a lower timeframe. Look for a precise entry point within a high-probability area, like a fresh order block or an unfilled fair value gap (FVG) that was created during the confirmation move.
Actionable Advice: The hardest part of trading this way is waiting. A true high-probability setup only occurs when every element on this checklist aligns. If a single piece is missing, the setup is invalid. Have the discipline to walk away; taking no trade is infinitely better than taking a bad one. This disciplined approach can be enhanced with tools like those in our VWAP trading strategy guide for added confirmation.
Executing and Managing Your SMC Trade
Finding a great setup is only half the battle. Disciplined execution and risk management are what determine profitability. Before you click "buy" or "sell," you need a complete plan for your entry, exit, and trade management.
Defining Your Entry and Stop Loss
SMC trading demands precision. Once your checklist is complete, zero in on your entry. Your entry should be a calculated decision at a refined point of interest (POI), like an order block or fair value gap.
- Entry: Place a limit order at your POI and let the market come to you. Don't chase the price with a market order.
- Stop Loss: Your stop loss is your invalidation point—the price where your trade idea is proven wrong.
- For a long entry from a bullish order block, place your stop loss just below the low of that block.
- For a short entry from a bearish order block, place it just above the high of the block.
Example:
- Asset: EUR/USD
- Entry (Limit Order): 1.08500
- Stop Loss: 1.08400 (10 pips of risk)
- Risk per trade: 1% of account balance
This defines your risk upfront, which is a cornerstone of professional trading.
Setting Realistic Take-Profit Targets
Knowing when to exit is as important as knowing when to enter. The most logical targets are opposing liquidity pools. If you took a long position after sell-side liquidity was swept, where is the price likely headed? To the nearest significant pool of buy-side liquidity—usually an old swing high.
A good rule of thumb is to target a minimum risk-to-reward ratio of 1:3 RR. This means for every $1 you risk, you aim to make at least $3.
- Entry: 1.08500
- Stop Loss: 1.08400 (10 pips risk)
- Take Profit Target (1:3 RR): 1.08800 (30 pips profit)
This mathematical edge ensures your wins can more than cover your losses over time.

Using SMC in a Prop Firm Environment
Trading for a prop firm is about proving you can generate profits while adhering to strict risk rules. The SMC framework, with its focus on high-probability setups and defined risk, aligns perfectly with a prop firm's requirements like daily loss limits and maximum drawdown. This patient approach is your best defense against violating rules.
Building Your Prop Firm Trading Plan
Passing a funding challenge requires consistency. Your plan must integrate SMC with the firm’s rules.
- Trade Selection: Only execute on A+ setups that meet your entire SMC checklist (HTF bias, liquidity sweep, BoS/CHoCH).
- Risk Per Trade: Define and stick to a fixed risk, typically 0.5% to 1% of your account. This ensures no single trade can jeopardize your challenge.
- Platform Execution: Practice executing SMC setups on the firm’s platform, like DXtrade or cTrader, before your evaluation begins. Familiarity prevents costly mistakes under pressure.
By focusing on high-quality, low-frequency trades, you demonstrate the discipline prop firms look for.
FAQ: Answering Common Smart Money Concepts Questions
Here are answers to some of the most common questions beginner and intermediate traders have about SMC.
Is SMC better than traditional technical analysis?
It's not about "better" or "worse." SMC focuses on the why behind price moves (institutional order flow), while traditional analysis often focuses on the what (patterns, indicators). Many successful traders blend both. For example, using an RSI divergence (traditional) to confirm a liquidity sweep (SMC) can create a powerful, confluent setup. No strategy guarantees profits; success comes from disciplined risk management and consistent execution.
How long does it take to learn Smart Money Concepts?
You can memorize the terms like "order block" and "liquidity" in a few weeks. However, achieving fluency—the ability to read price action intuitively and execute decisively—is a journey measured in months, or even years, of dedicated screen time, backtesting, and trade review. There are no shortcuts to developing a true feel for the market.
Can I use SMC on any timeframe or asset?
Yes. SMC principles are fractal, meaning the patterns of structure, liquidity, and order flow repeat on all timeframes, from the monthly chart down to the 1-minute chart. This makes the framework versatile for any trading style. A common workflow is to use a higher timeframe (e.g., 4H, Daily) to establish a directional bias and a lower timeframe (e.g., 5M, 15M) to find precise entries. These concepts apply equally to forex, indices, commodities, and crypto.
Smart Money Concepts provide a powerful lens for reading the story of price action. The real key to success lies not in the concepts themselves but in your disciplined application, iron-clad risk management, and the patience to wait for high-quality setups.
Ready to prove your skills in a real-world trading environment? Learn more about our funding programs and take the next step.
Or, if you’re ready to start, compare our account types to find the one that best fits your trading strategy.