If you're staring at a chart and your moving average keeps reacting too late, you're dealing with a common problem. The moving weighted average solves part of that by giving more importance to recent price action, but that extra speed can also get traders in trouble when risk limits are tight.
This guide breaks down how the moving weighted average works, where it fits against SMA and EMA, and how to use it without letting a few bad whipsaws wreck a prop evaluation. Trading involves risk of loss. This is educational only, not financial advice.
What Is the Moving Weighted Average
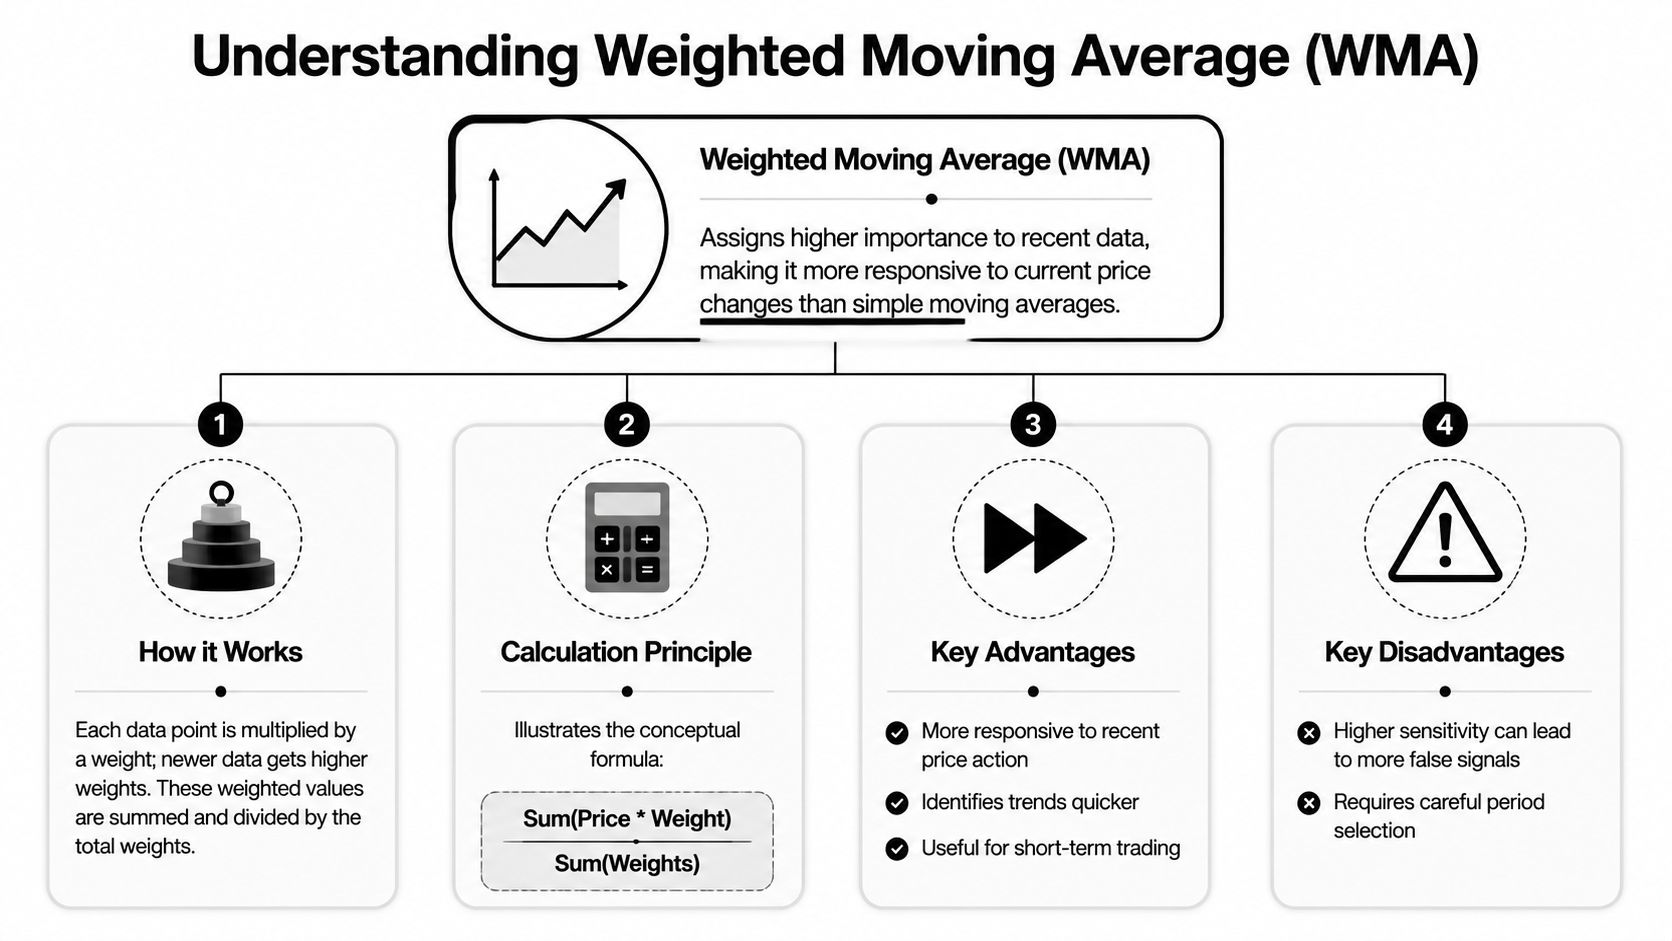
A moving weighted average, usually called a weighted moving average or WMA, is a moving average where each data point in the lookback window gets a different weight. The newer prices get more influence. Older prices still matter, but less.
A simple way to think about it is a vote count where recent votes matter more than older ones. If market conditions changed quickly in the last few candles, a WMA is designed to notice that shift faster than an equal-weight average.
The basic idea behind the weighting
In a common 5-period setup, the weights are often assigned linearly as 5, 4, 3, 2, 1 from most recent to oldest, and those weights sum to 15. That means the newest data point gets 5/15 = 33.3% of the influence, while the oldest gets 1/15 = 6.7%. A 5-period simple moving average would give each point an equal 20% weight instead, which is why WMA responds faster while still smoothing noise, as shown in this explanation of weighted moving average mechanics.
That's the whole edge of the indicator. It reduces lag by hard-coding a preference for what just happened.
A step by step 5-period example
Assume your last five closes are arranged from oldest to newest like this:
- Oldest price: 100
- Next price: 102
- Next price: 101
- Next price: 104
- Newest price: 106
Now apply the standard linear weights:
- 100 × 1
- 102 × 2
- 101 × 3
- 104 × 4
- 106 × 5
Then add those weighted values:
- 100 + 204 + 303 + 416 + 530 = 1553
Now divide by the sum of the weights:
- 1553 / 15 = 103.53
That gives you the 5-period WMA.
Notice what happened. The newest close at 106 had the largest effect because it got the largest multiplier. If price just accelerated, the WMA leans into that change faster than an equal-weight average would.
Practical rule: A moving weighted average is not “better” because it's faster. It's only better if your strategy needs faster information and your risk process can handle noisier signals.
Why traders care about this
The WMA matters because charting is always a trade-off between recency and stability. You want enough smoothing to ignore random noise, but not so much smoothing that you're late on every turn.
That same logic shows up outside trading too. If you work with time-series data in other settings, this primer on forecasting growth and impact is useful because it helps frame how weighting choices affect interpretation.
For traders, the takeaway is straightforward:
- Use WMA when recent candles matter most
- Expect quicker turns than an SMA
- Accept that quicker turns also mean more false movement in choppy conditions
WMA vs SMA and EMA Key Differences for Traders
Most traders don't need another abstract indicator debate. They need to know which average matches the job in front of them.
The three common choices are SMA, WMA, and EMA. All of them smooth price. They just do it differently, and that changes how they behave on a live chart.
What separates them on a chart
The simple moving average treats every value in the lookback period equally. In statistics, moving averages are recognized as a convolution, and the SMA behaves like a low-pass filter. The weighted form extends this by assigning higher coefficients to more recent observations, which is why WMAs react faster than SMAs in trending markets, making them a standard tool for confirming price turns, as outlined in this overview of weighted moving averages in market analysis.
That sounds technical, but the chart implication is simple:
- SMA is slower and smoother
- WMA is quicker and more direct
- EMA also emphasizes recent data, but it does so with exponential decay instead of a straight linear weighting pattern
If you want a broader primer on how moving averages fit into chart work, this guide to the moving average indicator is a useful companion.
WMA vs. SMA vs. EMA at a glance
| Characteristic | Simple Moving Average (SMA) | Weighted Moving Average (WMA) | Exponential Moving Average (EMA) |
|---|---|---|---|
| Weighting method | Equal weight to all data in the window | Higher linear weight to recent data | Exponentially higher emphasis on recent data |
| Responsiveness | Slowest of the three | Faster than SMA | Often very responsive |
| Smoothness | Smoothest | Less smooth than SMA | Can be very reactive |
| Best use case | Broader trend context | Short-term trend confirmation and faster entries | Momentum tracking and fast-follow trend systems |
| Main weakness | More lag | More whipsaws in chop | Can become too sensitive depending on settings |
When each one tends to work better
SMA fits traders who need stability
If you're filtering trend on a higher timeframe, the SMA is hard to beat for clarity. It doesn't overreact as much, which helps when you're trying to avoid forcing trades.
Use it when:
- You want a broad trend filter
- You're trading slower structures
- You care more about avoiding noise than catching the exact turn
WMA fits traders who want a cleaner fast average
The moving weighted average sits in a practical middle ground. It's more responsive than SMA, but it's still easy to understand because the weighting is transparent.
Use it when:
- You trade pullbacks in active sessions
- You want faster crossover signals
- You need an average that visibly tracks recent price pressure
EMA fits traders who prefer aggressive responsiveness
The EMA is common for momentum systems because it adapts quickly. That can help in strong directional conditions, but it can also make a weak market look tradable when it isn't.
A trader's biggest mistake with moving averages is asking which one is best in general. The real question is which one matches the pace of your market and the quality of your execution.
If you scalp fast intraday moves, WMA or EMA often makes more sense than SMA. If you're filtering larger structure and trying to stay out of bad trades, the SMA often earns its keep.
Practical Trading Setups Using the WMA
A moving weighted average becomes useful when it helps you make cleaner decisions, not when it gives you more lines to stare at. On most platforms, traders use it for two things: faster directional confirmation and pullback structure.
For a 5-period WMA, the most recent price gets weight 5, then 4, 3, 2, and 1, so the newest observations dominate the calculation. That's why traders often use it to confirm short-term trend direction or trigger faster crossover signals in liquid FX, index, and crypto markets, as described in Fidelity's guide to the weighted moving average indicator.
WMA crossover setup
This is the cleaner of the two setups when the market is already moving with intent. You're not trying to predict the bottom or top. You're looking for alignment.
Basic long idea
Use a faster WMA and a slower moving average. The exact settings depend on your market and timeframe, so keep them consistent when testing.
Entry checklist:
- Trend context first: Price should already be making higher highs and higher lows, or at minimum holding above a clear intraday base.
- Crossover second: The fast WMA crosses above the slower average with visible slope, not flat compression.
- Trigger candle matters: Enter on a candle that closes with direction, not on a weak wick through the line.
- Invalidation stays simple: Place your stop where the setup is wrong structurally, usually below the pullback low or beneath the local swing that produced the crossover.
Exit ideas:
- Scale at opposing structure: If price runs into prior intraday resistance, reduce exposure.
- Trail under the fast line only in clean trends: In messy tape, that trail is often too tight.
- Close if the crossover immediately fails: Fast reversals after entry are information.
The short version is the mirror image.
WMA as dynamic support or resistance
This setup works better in trends that have already proven themselves. Instead of chasing a breakout, you wait for price to return toward the moving weighted average and judge whether buyers or sellers still defend that area.
A common pattern looks like this:
- Price trends strongly
- It pulls back toward the WMA
- The pullback loses momentum
- A continuation candle prints from that zone
- You enter in the direction of the trend
Traders often combine WMA with another reference tool. If you also use volume-based structure intraday, understanding what VWAP is helps because VWAP and WMA answer different questions. WMA tracks recent price weighting. VWAP tracks price with volume context.
If a pullback touches your WMA but slices through market structure, the line didn't fail. Your read failed.
What works and what usually fails
Conditions that improve the setup
- Clear trend structure: The market should already be moving directionally.
- Session participation: WMA setups are cleaner when liquidity is present and candles have intent.
- Confluence: Prior highs, lows, session levels, or VWAP can help confirm that the setup isn't random.
Conditions that often ruin it
- Flat averages: A flat WMA in sideways conditions is not a signal.
- News-heavy noise: Fast averages can flip repeatedly when headlines hit.
- Late entries after extension: If price has already run hard, buying the first tiny touch of the line often means buying exhaustion.
The moving weighted average is a tool for timing inside an existing idea. It's rarely a complete idea on its own.
Fine-Tuning WMA for Prop Trading and Algo Strategies
In prop trading, speed is useful until it starts violating risk rules. That's a significant problem with the moving weighted average. It reacts quickly, but technical articles also warn that this responsiveness comes with more volatility, and traders increasingly use moving averages as one input in multi-filter systems rather than a standalone trigger, especially across forex, crypto, and news-heavy sessions, as discussed in this piece on weighted moving average trade-offs.
That matters a lot when a handful of bad entries can put your day in a hole.

The prop trading problem with WMA
A junior trader sees a fast average and thinks faster signals mean more opportunity. In a prop environment, that logic breaks down quickly.
Danger points are familiar:
- You take every crossover in chop
- You trade directly into a dead session
- You ignore scheduled news
- You size the same way in quiet and unstable conditions
A moving weighted average can help with timing. It can't protect you from bad context.
Filters that make WMA more usable
Most traders improve WMA performance by making it earn the right to trigger a trade.
Use a higher timeframe trend filter
A short-term WMA signal is much more useful when it agrees with broader direction. That can mean a higher timeframe trend read, a long-term average, or a clean market structure bias.
The point isn't perfection. The point is reducing low-quality countertrend trades.
Apply session selection
Not every hour deserves the same trust. Some sessions produce clean continuation. Others produce random mean reversion and fake momentum.
Create a simple rule set:
- Trade WMA continuation setups only during your proven session
- Skip signals during thin or transitional hours
- Stand down around scheduled event risk unless your system is built for it
Add a volatility filter
Fast indicators become dangerous in unstable conditions. If volatility expands sharply, a WMA can flip direction multiple times without delivering a usable trade.
That's why many systematic traders layer in a volatility condition before allowing the setup to fire. The exact tool can vary. What matters is consistency.
Better filters usually beat more signals. Especially when daily loss limits are strict.
Tuning for algorithmic use
If you code strategies, the moving weighted average is attractive because the calculation is simple and deterministic. The trap is overfitting.
Keep these points in mind:
- Optimize in blocks, not endlessly: Test a sensible range of periods rather than hunting for one perfect setting.
- Check different market regimes: A parameter that looks smart in trend may break in rotation.
- Model execution realistically: If your signal fires on fast bars, slippage and spread matter more than traders admit.
- Compare weighting logic, not just lookback length: Linear weighting behaves differently from exponential decay. That choice can change the trade frequency and failure pattern.
A good parallel exists outside trading systems too. If you've ever worked with large datasets, achieving faster SQL queries comes down to choosing efficient structures before you optimize outputs. WMA strategy design is similar. The structure of the signal matters before any tuning pass does.
One practical framework
For prop-style trading, an effective WMA process usually looks like this:
- Bias first: Decide long-only, short-only, or neutral from higher timeframe structure.
- Environment second: Check session quality and event risk.
- Signal third: Let the WMA handle timing, not market prediction.
- Risk last: Cut size or skip the trade if conditions are unstable.
On firms with clearly defined limits, including MyFundedCapital, traders using manual or algorithmic systems across platforms like cTrader and DXtrade still have to respect the same reality. Sensitive indicators need stricter filters, not more confidence.
A Backtesting Checklist for Your WMA Strategy
A moving weighted average strategy should earn trust through testing, not through a few clean screenshots. If you're planning to use it in a challenge or funded account, the question isn't whether the line looks good. The question is whether the rules survive bad conditions.
If you need a broader process reference, this guide on what backtesting is is a helpful starting point.
Core checklist before you risk capital
- Define exact rules: Write down entry, exit, invalidation, filters, and the market conditions that cancel the trade. “Looks good” is not a rule.
- Separate setup from execution: A valid signal and a tradable fill are not always the same thing. If the market moves too fast for your process, note it.
- Test multiple environments: Check trend, range, high-volatility periods, low-volatility periods, and session changes. WMA systems often look strongest in directional conditions and much weaker in chop.
- Include trading costs: Commissions, spread, and slippage can turn a marginal fast-moving-average strategy into a losing one.
- Track drawdown behavior: A strategy that wins but clusters losses badly may still be unusable under prop rules.
- Review invalid trades: Many systems fail not because the indicator is bad, but because the trader took signals in the wrong context.
What to review after the test
Use a journal or spreadsheet and look for patterns, not isolated trades.
Check for:
- Where the strategy loses repeatedly
- Whether specific sessions degrade results
- Whether countertrend trades underperform
- How often the first signal works versus the second or third
Don't ask whether the WMA strategy can make money. Ask whether it can survive your execution, your market, and your risk limits.
A short stress-test routine
Run the same rules in three passes:
- Normal conditions
- More conservative assumptions on costs
- A reduced-trade version with stricter filters
If the strategy only works under ideal assumptions, it probably isn't ready.
Frequently Asked Questions About the WMA
What's the best moving weighted average setting
There isn't one best setting. The right lookback depends on what you trade, how fast the market moves, and whether you're using the WMA for trend confirmation, pullbacks, or crossover timing.
Shorter settings react faster but produce more noise. Longer settings smooth better but can lag enough to make entries late. The only honest answer is to test a small set of logical parameters and judge them against your own execution and risk rules.
Does the WMA work on every timeframe
Yes, but it doesn't behave the same way on every timeframe.
On lower timeframes, the moving weighted average reacts quickly and can help with intraday timing. It can also produce more fake turns when the tape is erratic. On higher timeframes, it becomes more useful as a trend guide, but the signals arrive less often.
The key is matching the indicator to your decision cycle. If you hold trades for minutes, a high-timeframe WMA alone won't help much with timing. If you hold for days, a very fast WMA may create unnecessary exits.
Is WMA better than EMA
Not automatically.
A WMA uses a clear linear weighting structure. An EMA emphasizes recent data through exponential decay. In practice, both are built to react faster than a simple moving average, but they can feel different on a chart.
Choose WMA if you want:
- Transparent linear weighting
- A straightforward response to recent bars
- A clean tool for pullback and crossover work
Choose EMA if you want:
- A very common momentum average
- Fast adaptation in directional conditions
- A tool already built into many systematic templates
The better choice is the one that produces cleaner decisions in your tested process.
How does the moving weighted average perform in ranging markets
Usually worse than traders expect.
Ranging conditions are where fast moving averages get traders chopped up. The line keeps responding to small swings, and those swings often don't turn into continuation. That creates repeated crossover failures and poor entries near the middle of the range.
If the market is rotating sideways:
- Reduce trade frequency
- Demand stronger confirmation
- Focus on range boundaries rather than every line interaction
- Consider skipping the setup entirely if the average is flat
That restraint saves more accounts than any indicator tweak.
If you want to apply a moving weighted average inside a funded-trader framework, review the rules before you trade the signal. Explore MyFundedCapital to compare funding programs, account types, and challenge paths, then choose a structure that fits your strategy, platform, and risk discipline. Trading involves risk of loss, and funded evaluations still require consistent execution.