

 AR
AR
 NL
NL
 EN
EN
 FR
FR
 ES
ES
 IT
IT
 PL
PL
 SV
SV
 PT
PT

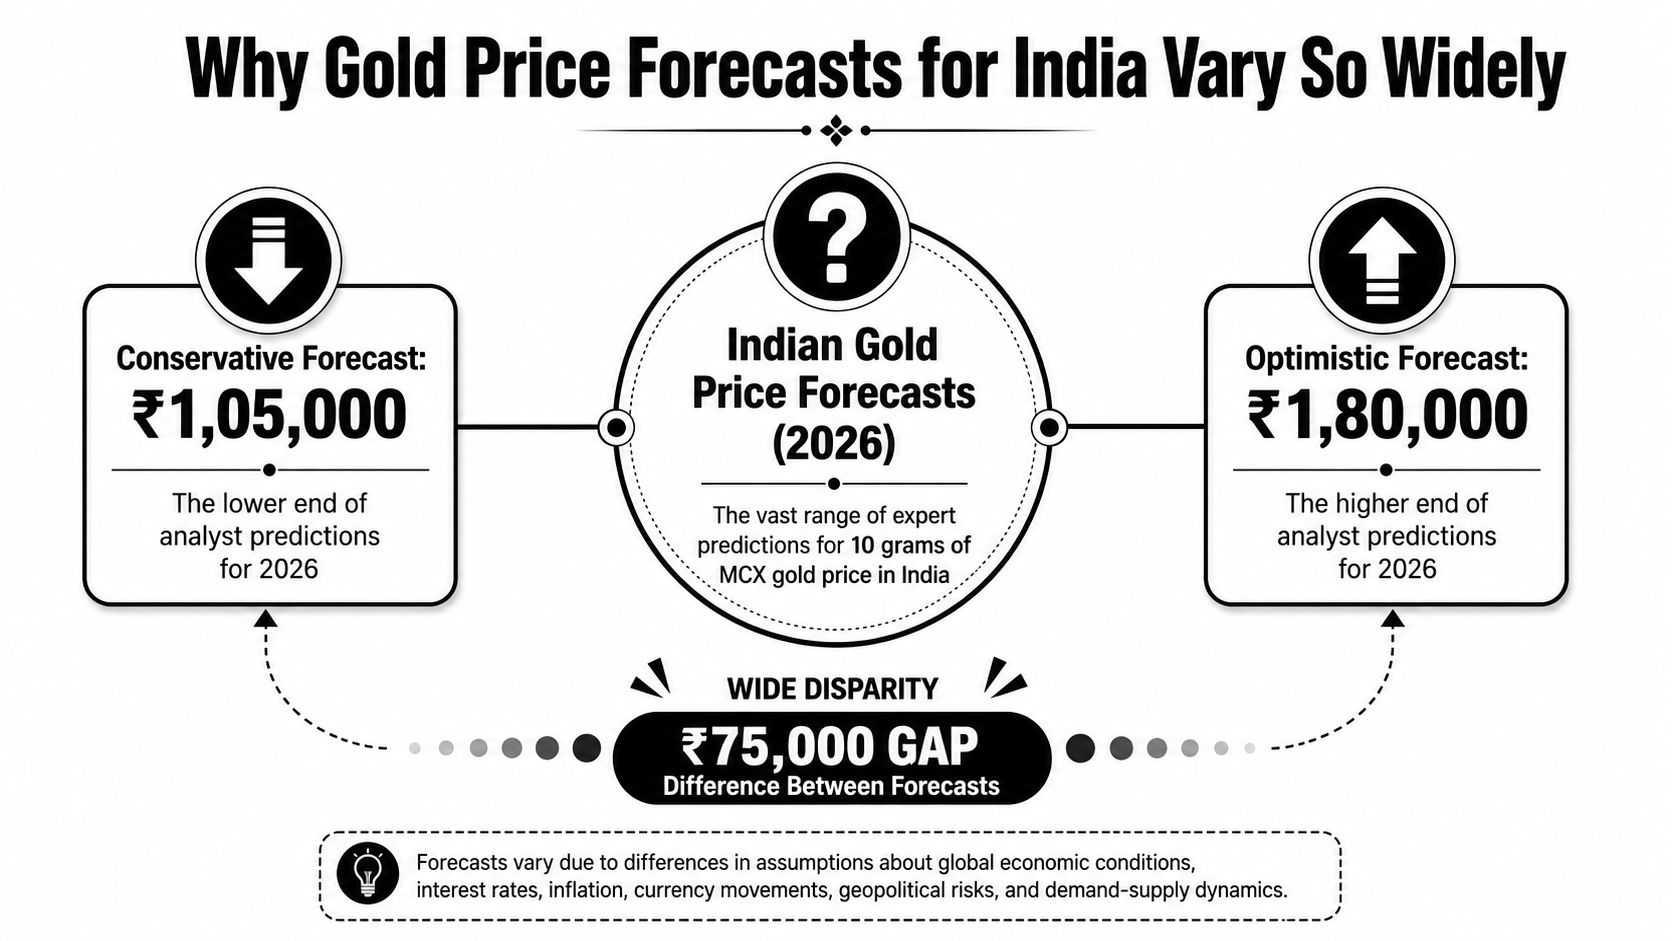
MCX gold forecasts for 2026 sit in a wide band, from about ₹1,05,000 to ₹1,80,000 per 10 grams, and that spread tells you more than any single headline target. The key question is not just whether gold rises, it's whether the move comes from global bullion, a weaker rupee, or both.
Gold prediction articles in India often skip that distinction. Traders who read the rupee chart alongside the international gold chart usually get a clearer answer, because domestic prices can rise even when global bullion goes nowhere if the INR keeps slipping.
Why Gold Price Forecasts for India Vary So Widely
The problem with a single rupee target
Most readers search for predictions for gold prices in India expecting one clean number. That's a bad way to read the market. A rupee target without the assumptions behind it is just a headline, not a forecast.
The core issue is that Indian gold is priced through two moving parts, international bullion and the USD/INR rate. If global gold holds firm and the rupee weakens, domestic MCX gold can still climb. If global gold softens but the rupee slides faster, the local price can look stubbornly strong anyway.
That is why forecasts can look contradictory and still be internally consistent. One analyst may be modeling a stronger dollar and a weaker rupee, while another may be assuming a pause in global gold but continued INR depreciation. The number on the page changes because the currency regime changes.
Practical rule: treat every Indian gold forecast as a bundle of assumptions, not a promise.
The useful way to read any target is simple. First, ask what global gold assumption sits underneath it. Then ask what the analyst is assuming for the rupee. Only after that does the domestic number make sense.
Recent Trends and the Historical Context That Shapes Them
How the market got comfortable with higher targets
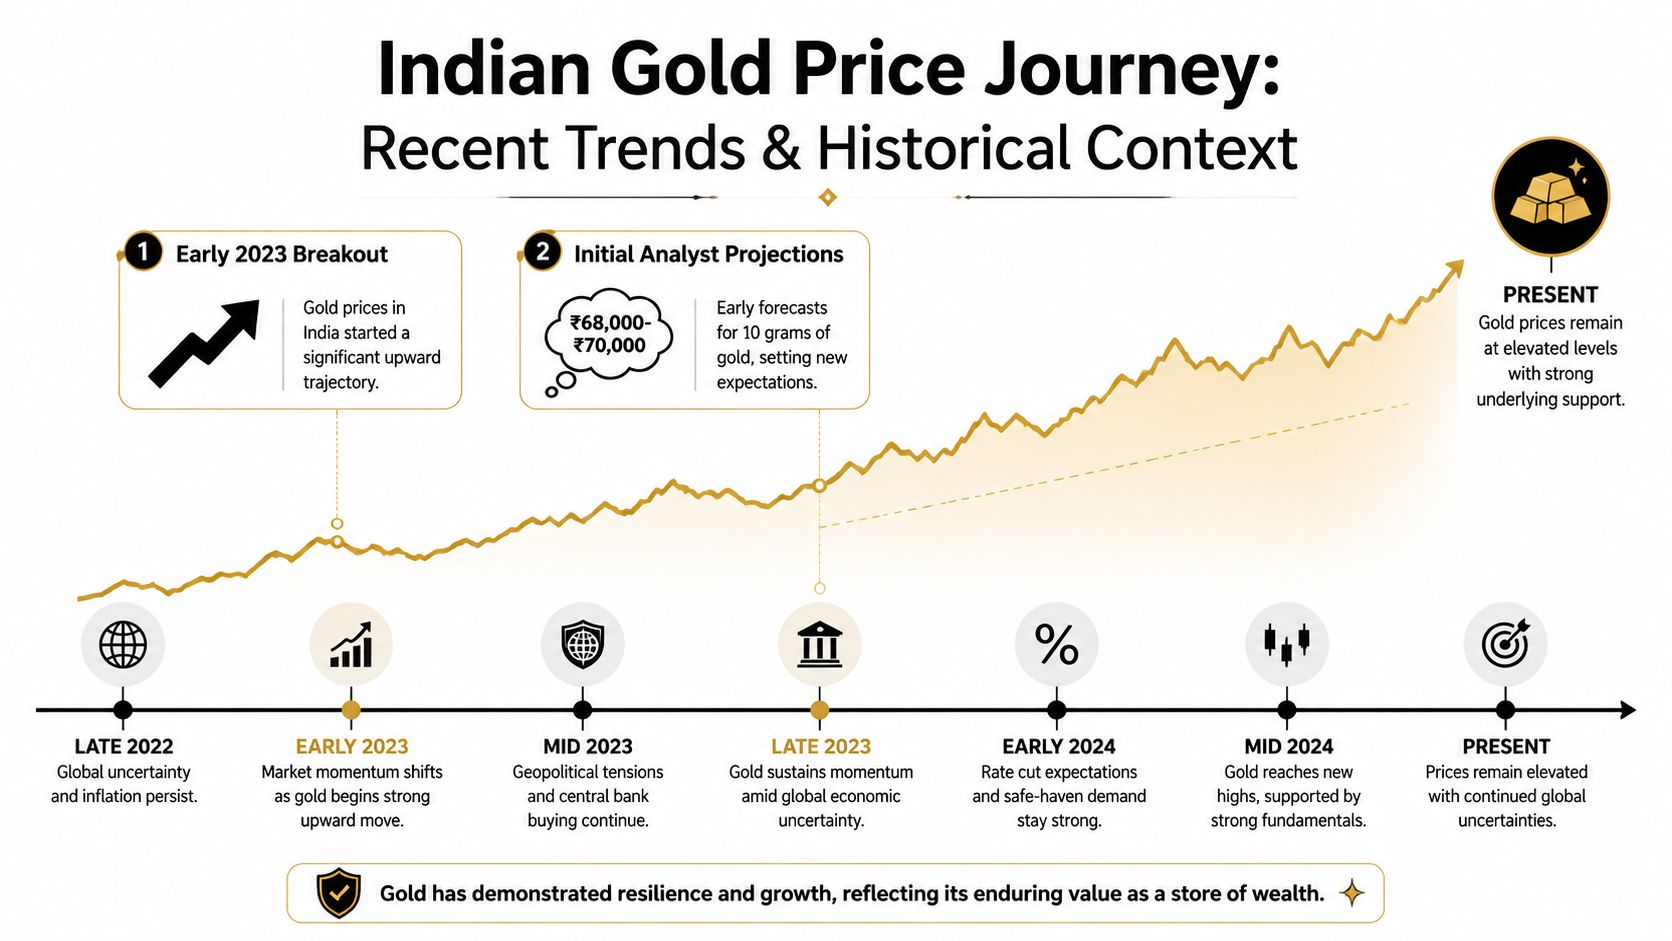
The recent gold cycle changed the way traders think about targets. Once global bullion moved decisively above $2,000/oz, the market stopped treating five-digit domestic prices as an outlier and began to treat them as part of the normal forecast range. That shift matters because it lowered the psychological barrier for both international and MCX pricing.
The bigger lesson is that Indian forecasts are never driven by spot gold alone. In late 2023 and early 2024, analysts were discussing $2,250/oz globally and about ₹67,000–₹68,000 per 10 grams in MCX terms, while another set of views clustered around $2,250–2,300/oz and ₹68,000–70,000 domestically if rate cuts and geopolitical tension persisted, as reported by The Hindu BusinessLine. Those numbers were not just a call on bullion. They also reflected a view on the rupee, which can magnify or soften every move in the global price.
A stronger global gold market gives the forecast its direction. The INR path often determines how far that move shows up in India.
Why old forecasts are useful, but not enough
Historical forecasts help only if they are read against the next macro regime. Gold rarely moves in a straight line for long. It tends to rally, consolidate, and then reprice when the market gets new information on rates, geopolitics, or currency direction.
That is why older bullish calls should be treated as context, not as a template. A forecast built on a weak dollar and a softer rupee can look accurate for a while, then lose relevance if the currency backdrop changes. Indian traders who follow commodity market research and trading frameworks know that the same bullion move can produce very different MCX outcomes depending on how INR behaves at the same time.
Bajaj Finserv's five-year gold price trend outlook also shows how much these assumptions matter. Its projection for 2025–2029 places domestic gold in a rising band from ₹1,63,000–₹1,79,000 in 2025 to ₹1,79,000–₹1,95,000 in 2029, and it also cited a 2025 view that gold could rise to just above ₹269,798 in its own framework. Separately, the same broad bullish theme was used alongside expectations of 10–11% annual return in 2024 and a target of ₹67,000–₹68,000 per 10 grams for MCX gold in Bajaj Finserv's gold price trend outlook.
The useful conclusion is narrow but important. Bullish forecasts are often right inside a specific mix of global prices, real rates, and rupee weakness. Once that mix changes, the market usually spends time digesting gains before it accepts the next higher target.
Key Drivers That Move Gold Prices in India
Global bullion is the first input, not the whole answer
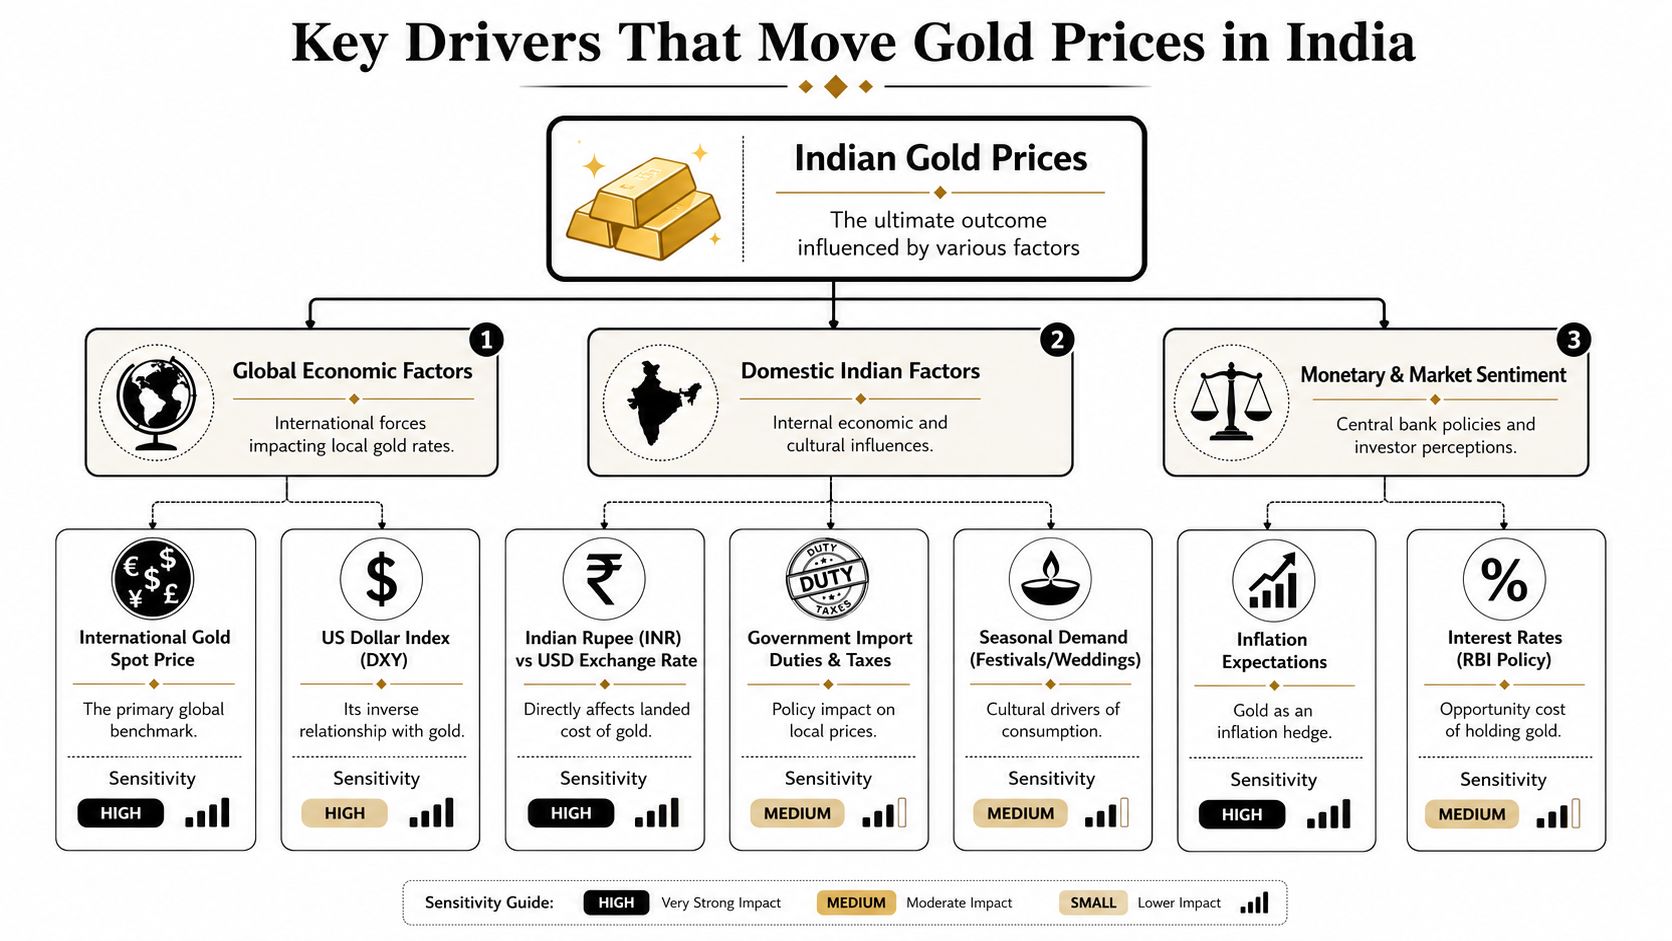
International spot gold still sets the tone. When the global benchmark rises, MCX gold usually follows. But Indian traders should avoid thinking in a one-variable model, because the local price is also a currency story.
The USD/INR exchange rate is often the bigger hidden driver than people admit. India imports most of its gold, so a weaker rupee raises the landed cost even if the international spot price is flat. That is the reason domestic gold can keep making new highs while global bullion looks stuck.
Domestic policy and seasonality change the path
RBI policy influences real rates and opportunity cost. When rates are higher and real yields improve, holding non-yielding gold becomes less attractive. When inflation expectations stay high, gold regains some of its appeal as a store of value.
Import duties and taxes can also shift the retail price structure. They don't change the global benchmark, but they do change what the Indian buyer pays. Seasonal demand around weddings, Akshaya Tritiya, and Dhanteras can support local premiums, especially when buyers rush physical purchases into short windows.
Market sentiment is the third layer
Gold ETF flows matter because they tell you whether investors are using gold as a tactical allocation or just watching from the sidelines. Physical jewellery demand matters too, but it works differently from investment demand. One is price-sensitive and seasonal, the other is more macro-driven.
Use this lens: if global gold is flat, check INR first before you assume the domestic trend is weak.
For a trader who wants a broader commodities framework, this commodities trading guide is a useful companion, especially if you're mapping gold against oil, silver, and other correlated markets.
Short, Medium, and Long-Term Forecasts Compared
The market is not giving one forecast, it's giving a range of regimes
Gold forecasts in India diverge because they rest on different assumptions about two separate variables, global bullion and the INR/USD exchange rate. A call that looks modest in dollar terms can still translate into a strong domestic move if the rupee weakens. That is why the same metal can produce very different price paths for Indian buyers, even when the international headline looks unchanged.
| Time Horizon | Forecast Range (₹/10g) | Source | Key Assumption |
|---|---|---|---|
| Short term | ₹1,42,800–₹1,43,200 support, with downside toward ₹1,36,000–₹1,37,000 if broken | Times of India market coverage | Bearish momentum unless price reclaims the 20-day average |
| Short to medium term | ₹1,52,500–₹1,53,500 bounce zone from support near ₹1,50,000–₹1,50,200 | Economic Times commodity radar | Mean reversion if support holds and U.S. data softens |
| Rest of 2025 | ₹99,500–₹1,10,000 | NDTV report on ICICI Bank Economic Research Group | Base case into year-end, with macro support intact |
| First half of 2026 | ₹1,10,000–₹1,25,000 | NDTV report on ICICI Bank Economic Research Group | Continued upside if global conditions stay supportive |
| 2026 remainder | ₹1,50,000–₹1,80,000 | Economic Times report on 2026 pricing | Stronger structural bullish case |
| 2027 | ₹1,60,000–₹1,90,000 | Economic Times report on 2026 pricing | Continuation of the same trend if macro support persists |
| 2025 to 2029 | ₹1,63,000–₹1,95,000 | Bajaj Finserv five-year forecast | Long-run structural uptrend |
| Dhanteras near term | ₹1,20,000–₹1,30,000, with ₹1,26,000–₹1,28,000 seen as more realistic | Moneycontrol expert view | Event-driven move, but not a shock scenario |
| 2026 bullish bank targets in USD | $3,600–$5,000/oz | Economic Times on global bank forecasts | Diverging assumptions across major banks |
What the spread really means
The spread is the true signal. It shows that analysts are not disagreeing on direction alone, they are assigning different weights to global bullion, rupee weakness, and safe-haven demand. That matters for India because the domestic price can move sharply even when the dollar gold price is only advancing in a measured way.
The shorter-horizon calls mostly depend on whether support survives and whether the next macro print weakens the dollar. The medium-term calls are more sensitive to the rupee, because a softer currency can add to the landed cost even if international gold moves in a narrow band. The longer-horizon calls are where structural assumptions become visible, especially the belief that central-bank buying, inflation pressure, and persistent geopolitical risk will continue to support the metal.
For a cleaner way to judge those assumptions, use this gold outlook note. It is useful for separating the global bullion view from the INR channel, which is often the part that changes the domestic forecast most.
Technical Levels and Indicators on the MCX Chart
The chart still looks corrective, not trendless
The near-term setup is technically bearish after MCX gold slipped below the 20-day Bollinger Band average. Resistance sits around ₹1,45,500, with the key 20-day moving average near ₹1,49,800, and that matters because reclaiming the average is usually the first sign that sellers are losing control.
On the downside, immediate support is clustered around ₹1,42,800–₹1,43,200. If that gives way, the next zones are ₹1,36,000–₹1,37,000, then the ₹1,32,000 retracement area that traders are watching as a deeper support pocket. The structure says correction first, reversal only if momentum improves.
What momentum is telling traders
A more constructive medium-term read appears when price stabilizes near ₹1,50,000–₹1,50,200. That area has been described as immediate support, with RSI near 40 to 41, EMA 21 flattening, and MACD still negative but easing in recent commodity coverage. That combination usually tells you downside pressure is fading, but buyers still need confirmation.
For active traders, the setup is straightforward:
- Above ₹1,49,800: the market starts reclaiming control from sellers.
- Between ₹1,50,000 and ₹1,53,500: mean reversion becomes a live trade idea.
- Below ₹1,43,200: the correction likely continues.
- Below ₹1,36,000: the market stops looking like a shallow pullback.
A chart does not need to be bullish for you to trade it well. It only needs clear invalidation levels.
For a cleaner technical workflow, this technical analysis guide for traders is a practical companion when you're mapping entries, stops, and targets.
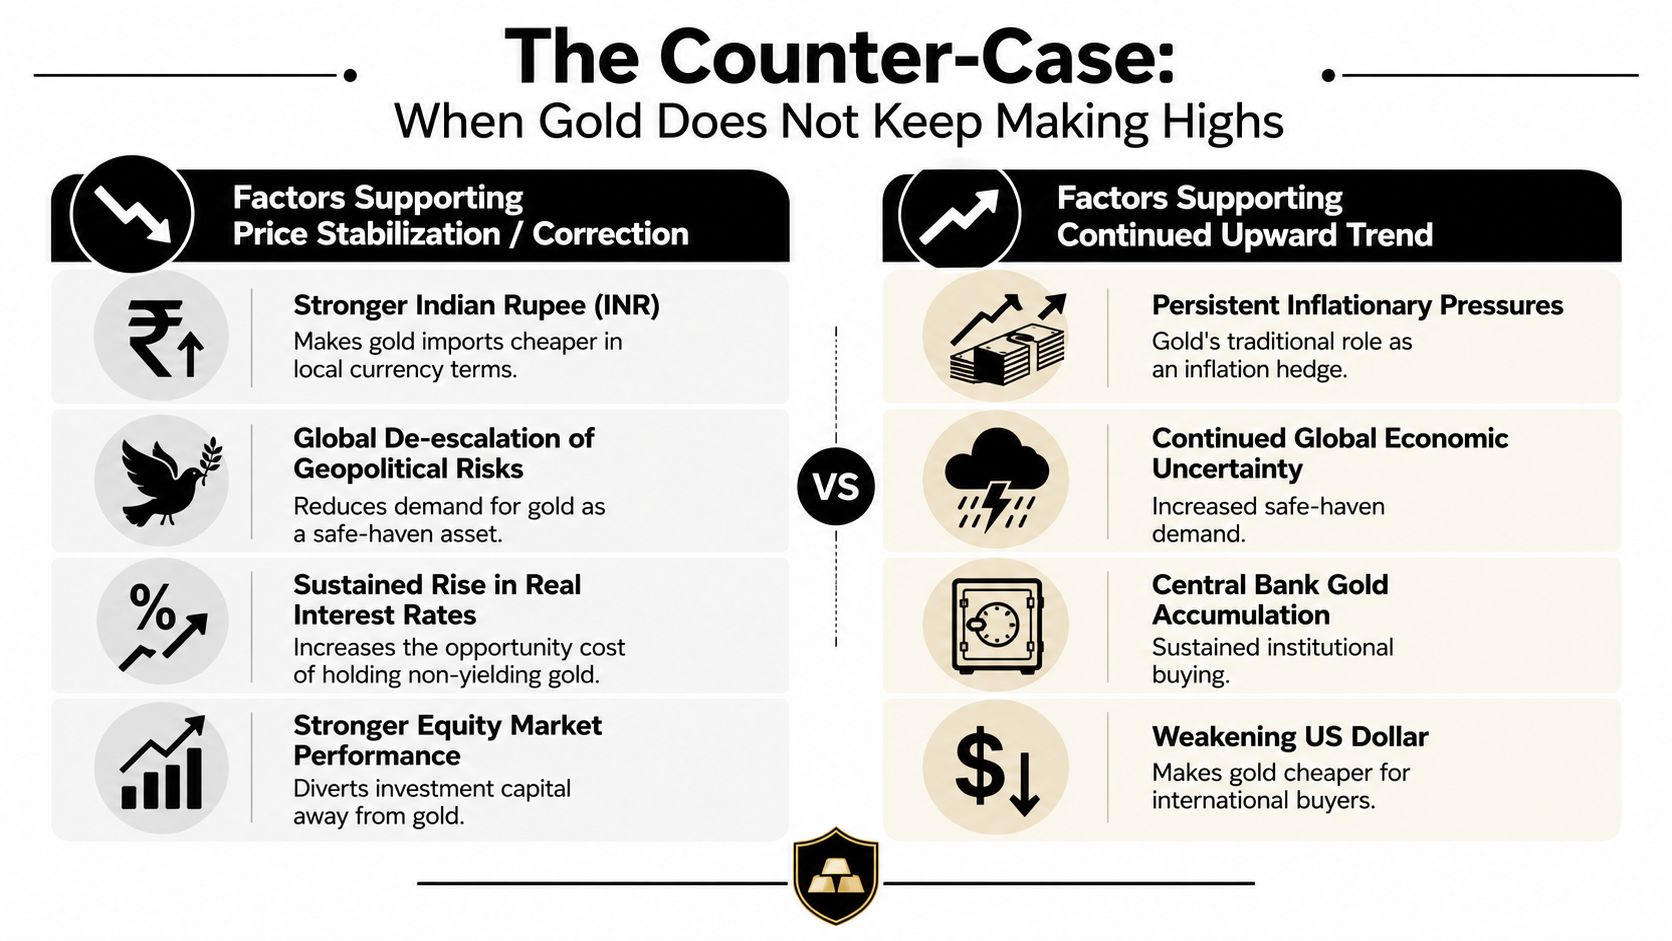
The Counter-Case When Gold Does Not Keep Making Highs
Why a range-bound phase is still plausible
The bullish Indian gold narrative is crowded. That alone is a warning sign for disciplined traders. When too many forecasts assume higher prices, the market often spends time proving that consolidation can last longer than people expect.
The stabilization case starts with a stronger rupee and a firmer dollar environment. If geopolitical tension cools, real rates stay higher, and equities attract fresh capital, gold can stop making new highs even if nothing dramatic breaks. In that setting, buyers lose urgency and the market digests prior gains.
A useful anchor for this view is the explicitly more cautious ₹60,000–₹75,000 per 10 grams for 2026 style of base case mentioned in recent Indian commentary, which sits far below the most aggressive forecasts. That gap is exactly why readers should not treat every bullish number as consensus.
What history suggests about long pauses
Gold has a habit of consolidating after strong advances. That doesn't mean it collapses. It means the market sometimes needs a long stretch to clear excess optimism, especially after a fast multi-year rally.
The main mistake traders make is assuming that every strong macro backdrop becomes a straight-line trend. It doesn't. If the dollar strengthens and risk appetite improves at the same time, gold can spend months moving sideways while analysts keep printing higher targets.
The key takeaway is simple. Gold is still a structural hedge, but the next phase does not have to be another vertical leg higher. A range, or a slow grind, is a completely legitimate outcome.
Trading Implications and Risk Management for Active Participants
Build the trade around the worst plausible case
If you trade gold actively, your first job is not to predict the biggest upside target. Your first job is to decide where your idea fails. That means structuring every position around the support and resistance zones already mapped, instead of entering because a forecast sounds convincing.
Keep size small enough that a failed breakout doesn't force a reset. If you're trading under a prop-style rule set with a 5% daily loss limit and 10% maximum drawdown, the trade has to survive normal noise, not just be right eventually. A large position with a narrow thesis is how traders blow up on a single macro print.
Treat catalysts as risk events, not opportunities by default
Nonfarm Payrolls, unemployment data, and geopolitical shocks can invalidate a technically clean setup in seconds. If you don't have a defined edge around those releases, stand aside. A missed trade is cheaper than a forced exit into a spike.
Use bracket orders when the market is sitting near major levels. Place the stop where the setup is wrong, not where the loss feels comfortable. If you're swing trading, decide in advance whether you'll hold through weekends and news, because those choices change your risk profile more than most entry signals do.
For traders who also follow third-party idea streams, a curated resource like find profitable Telegram trading signals can be useful as a scan tool, but it should never replace your own level-based plan.
Rule of thumb: if the trade only works in one clean market condition, the risk is probably too high.
Frequently Asked Questions and Final Takeaways
Is ₹1.5 lakh per 10 grams realistic for 2026? Yes, it is realistic in the bullish frameworks already in circulation, but it is not the only plausible outcome. The range matters more than the headline, because domestic prices can be pushed higher by the rupee even if global bullion pauses.
How much of the move is INR-driven versus spot-driven? Often both, but Indian traders should check the rupee first whenever global gold looks flat. A weak INR can lift domestic MCX gold without any dramatic change in international bullion.
Can gold hold up if the dollar strengthens? It can, but the upside usually becomes harder to sustain. In that scenario, gold needs another driver, like geopolitical stress or persistent inflation, to keep the trend alive.
What should a trader do after a sharp run? Don't chase every bullish target. Wait for support to prove itself, and size the position as if the market can stay range-bound longer than expected.
Trading involves risk of loss, and this content is educational only, not financial advice. If you want to apply a disciplined, level-based approach to commodities inside a structured risk framework, explore MyFundedCapital and compare its funding programs, challenge paths, and account options before you trade live capital.
