

 AR
AR
 NL
NL
 EN
EN
 FR
FR
 DE
DE
 ES
ES
 IT
IT
 PL
PL
 SV
SV


Spotting a potential market reversal can feel like trying to catch a falling knife, but certain chart patterns can give you an edge. The double top pattern is a classic bearish signal that can help you identify when an uptrend is losing steam and a downtrend might be starting. This guide will break down how to identify, validate, and trade this powerful pattern with practical, step-by-step advice.
Trading involves a significant risk of loss and is not suitable for all investors. This content is for educational purposes only and is not financial advice.
What a Double Top Tells You
Think of the double top as a story of a failed rally. It's a powerful visual clue that an asset, after a solid run, is hitting a ceiling it just can't break. For traders, spotting this struggle early is key, as it indicates buying pressure is fading and the market's mood could be about to sour.
Here’s the anatomy of a true double top pattern. Each piece tells part of the story:
- A Solid Uptrend: First, you need context. The pattern is only significant if it appears after a clear, sustained move higher.
- Two Failed Peaks: The price hits a high, pulls back, and then tries to rally again but stalls out near the same price level as the first peak. This failure to set a new high is the first red flag.
- The Valley (or Neckline): The lowest point the price hits between those two peaks creates a crucial support level. We call this the neckline.
- The Neckline Break: The bearish signal is only confirmed when the price breaks below that neckline support. This is the moment sellers have officially taken control.
Imagine a mountain climber making two separate attempts to reach a summit. The first attempt gets them to a high point, but they're forced to retreat to a lower base camp. Their second attempt fails at the exact same altitude. This exhaustion and failure to push higher often comes right before a major slide back down the mountain. To spot these formations effectively, you need a good grasp of chart analysis, which includes knowing how to read crypto charts and other financial instruments.
The double top gives you a clear, actionable trading plan. It provides a specific entry point (the break of the neckline), a logical spot for a stop-loss (just above the twin peaks), and a framework for projecting a price target. While no pattern is a crystal ball, the double top gives you a statistical edge by flagging high-probability shorting opportunities. It's a fundamental pattern, and once you've mastered it, you can explore other powerful chart patterns in forex to build out your trading arsenal.
The Anatomy of a High-Probability Double Top Pattern
Anyone can spot an "M" shape on a chart. But to consistently find a double top pattern that’s actually worth trading, you need to dig deeper. A true double top leaves a specific trail of evidence that tells the story of a dying uptrend. Miss one of these clues, and you might be walking right into a bull trap.
The Five Crucial Stages of a Double Top
A textbook double top isn’t a single event; it unfolds in five distinct acts. If you can learn to spot these, you'll have a reliable checklist to validate the pattern before putting any capital on the line.
The Preceding Uptrend: First, there must be a hill to climb. The pattern is only significant if it appears after a clear, established uptrend. Without this, there’s no reversal to trade.
The First Peak: The market pushes to a new high but then stalls out. Buyers hit a wall of resistance, and their initial momentum starts to fade.
The Valley (Neckline): After being repelled, the price pulls back. It finds temporary support, forming a trough between the peaks. This low point is critical—it draws the neckline, which becomes the line in the sand for the entire pattern.
The Second Peak: Buyers regroup and try to take the high ground again. But this time, their attack sputters out at or just below the level of the first peak. This second failure is a huge warning sign that the bulls are exhausted.
The Neckline Break: This is the moment of truth. The price crashes through the support level of the neckline. Sellers have seized control, and the retreat has officially begun.
This flowchart gives you a bird's-eye view of how the market's journey shifts from bullish optimism to a full-blown bearish reversal.
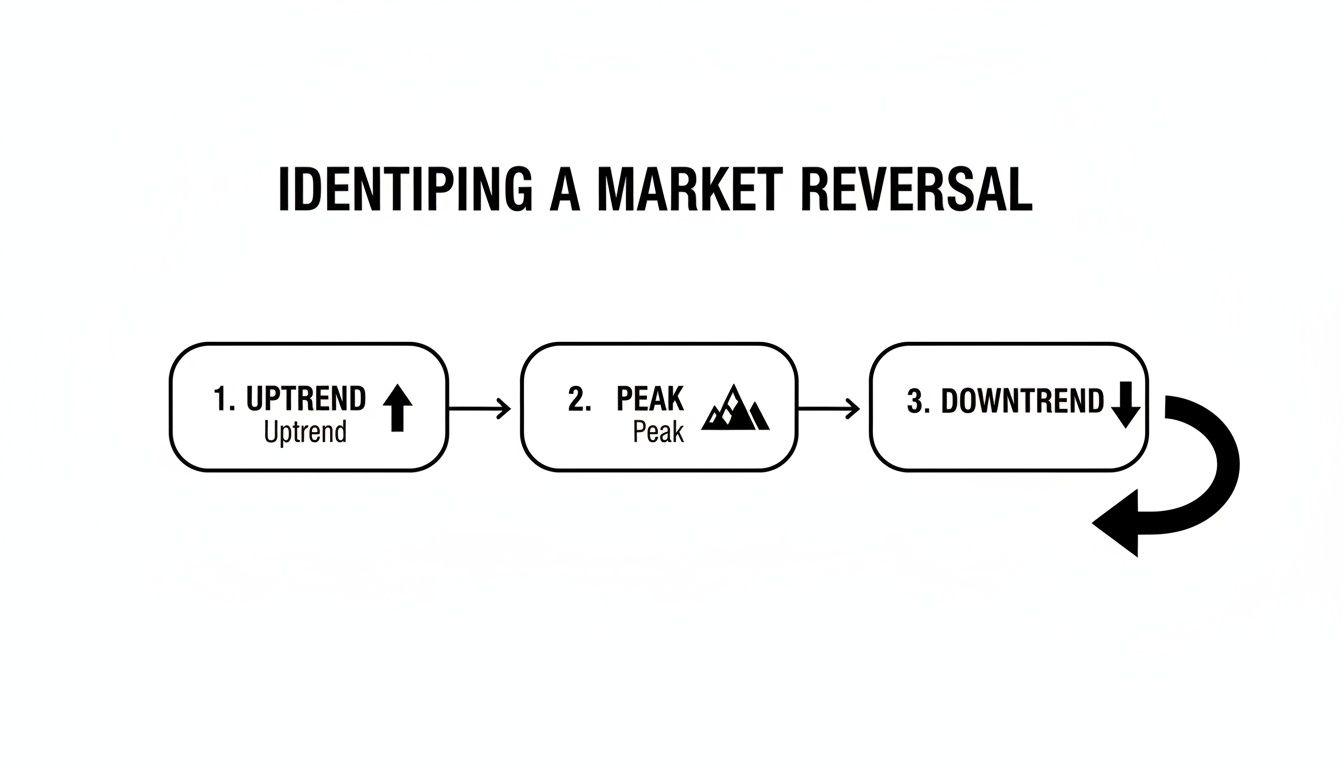
As you can see, the pattern's lifecycle shows how an uptrend loses steam at the peaks before the bears take charge and drive the market into a new downtrend.
Volume: Your Secret Confirmation Tool
One of the most telling pieces of evidence—and one that many traders ignore—is volume. In a high-quality double top, the volume on the second peak is almost always lower than the volume on the first. Lower volume on the second peak tells you there's less conviction behind the move. Fewer buyers are participating, and the buying pressure is drying up.
A study on major forex pairs like EUR/USD from 2000-2020 found that double tops on the daily chart with volume divergence—where the second peak has 20-30% lower volume—correctly predicted a move lower over 65% of the time. You can read more about the core ideas behind these patterns in the fundamental principles of technical analysis on Wikipedia.
Practical Trading Strategies for the Double Top Pattern
Spotting a double top is one thing, but trading it requires a rock-solid plan. Let's walk through exactly how to trade this setup, covering your entry, your exit, and how to manage risk. Remember, no strategy guarantees profits, and managing risk is your primary job as a trader.

Step 1: Choose Your Entry Strategy
When it comes to entering a double top trade, there are two main approaches. Neither one is "better"—they just represent a different trade-off between risk and reward.
- The Aggressive Entry (Breakout): Enter a short (sell) order the moment the price closes decisively below the neckline. This gets you in early but is more vulnerable to false breakouts, where the price dips below the neckline only to reverse sharply higher.
- The Conservative Entry (Pullback): Wait for the price to break the neckline, then rally back up to "retest" that level from below. Entering short on this retest confirms that old support has become new resistance, filtering out many false signals. The risk is that a strong downtrend may not offer a pullback, causing you to miss the move.
Step 2: Set Your Stop-Loss and Profit Targets
No trading strategy is complete without clear rules for where you get out. The double top provides a logical map for this. For a deeper look, check out our complete guide on how to effectively set your stop-loss and take-profit levels.
Setting the Stop-Loss:
Your stop-loss defines your maximum risk. It's a non-negotiable part of your trade plan.
- Above the Peaks: The safest spot is just above the highest of the two peaks. This gives the trade room to breathe but requires a wider stop, which might mean using a smaller position size.
- Above the Neckline: After a pullback entry, placing the stop just above the retested neckline creates a tighter risk profile and improves your risk-to-reward ratio.
Setting the Profit Target:
The classic technique for projecting a minimum profit target is the measured move.
- Step 1: Measure the vertical distance (in pips, points, or dollars) from the highest peak down to the neckline.
- Step 2: Project that same distance downward from the neckline break point.
Concrete Example:
Let's say EUR/USD forms a double top. The peaks are at $1.2000 and the neckline is at $1.1900.
- Pattern Height = $1.2000 – $1.1900 = 100 pips.
- Your minimum profit target would be $1.1900 (the neckline) minus 100 pips, which lands at $1.1800.
Always ensure your trade setup offers a positive risk-to-reward ratio. Risking 50 pips for a potential profit of 100 pips (a 1:2 ratio) helps build a sustainable edge. You can discover more insights about its application across different markets.
Confirmation Signals That Filter Out False Double Tops
False signals are a frustrating part of trading. The trick is to learn how to separate the high-probability setups from the fakes by demanding more proof before you put capital on the line.
Think of it like a detective building a case. The double top pattern is your main suspect, but you need corroborating evidence from other technical indicators.
Volume Analysis: The First Layer of Defense
Volume tells you about the conviction behind a move.
- A high-probability double top will show noticeably lower volume on the second peak compared to the first. This suggests buying enthusiasm has dried up.
- A surge in selling volume as the price breaks the neckline confirms that sellers are taking control.
Momentum Divergence: A Telltale Sign of Weakness
Next, look at momentum oscillators like the Relative Strength Index (RSI). We're hunting for bearish divergence.
Here’s what it looks like:
- The price chart makes a second peak, hitting roughly the same high as the first.
- At the same time, your RSI makes a distinctly lower high.
This shows that even though price struggled back to its previous peak, the underlying momentum was much weaker, making a reversal more likely. The same principle applies to other oscillators, which you can learn more about in our guide on how to read the MACD indicator.
Using Moving Averages for Context
Finally, moving averages (MAs) are great for giving you the bigger picture. A simple but effective technique is to add a 50-period MA to your chart.
- The double top forms.
- The price breaks the neckline.
- For extra confirmation, wait for the price to also break and close below the 50 MA.
When the price falls below a significant moving average, it indicates a deeper shift in market sentiment from bullish to bearish, giving your short trade a more solid foundation.
Does the Double Top Actually Work? A Look at the Stats
A textbook double top might look perfect, but is it actually giving you a real statistical edge? Trading is a game of probabilities, and the double top is no exception. Its reliability depends on the market, timeframe, and how you confirm the signal.
Putting Numbers to the Pattern
Let's look at what the research shows. One analysis of the Nasdaq 100 from 2005-2020 found that 68% of confirmed double tops on the daily chart led to a downturn. The pattern's failures often occurred when the two peaks formed too quickly (in under 20 days) or during periods of low volume.
Context is everything. You can dig into the specifics of these findings and see how they were calculated by reviewing the study's double top statistics. The key takeaway is that a double top shouldn't be traded in a vacuum. It becomes a high-probability setup only when you confirm it with other tools.
Double Top Pattern Success Rate by Market & Timeframe
This table provides a glimpse into how the double top's performance can vary. These are estimated success rates based on historical data where the pattern was confirmed by a clear break of the neckline.
| Market | Timeframe | Estimated Success Rate | Key Confirmation Signal |
|---|---|---|---|
| Major FX (EUR/USD) | H4 | ~65% | Neckline break with above-average volume |
| Crypto (BTC/USD) | Daily | ~62% | Bearish divergence on the RSI |
| Indices (S&P 500) | H1 | ~68% | Failed retest of the broken neckline |
| Commodities (Gold) | Daily | ~70% | Formation over 30+ days |
As you can see, the odds change based on the asset's behavior. Gold, for example, tends to form more reliable, longer-term tops, while the fast-moving crypto market might show more false signals.
How to Backtest the Double Top for Yourself
Reading studies is one thing, but nothing builds confidence like running the numbers yourself. You can do this manually on platforms like cTrader or TradingView.
- Define Your Rules: Be specific. What makes a double top valid? What is your entry, stop-loss, and target? Write it all down.
- Go Back in Time: Scroll your chart back 6-12 months.
- Find Setups: Advance the chart one candle at a time, looking for patterns that match your rules.
- Log Every Trade: Record each trade in a spreadsheet—date, entry, stop, target, and outcome. Be honest.
- Analyze the Data: After 50-100 trades, crunch the numbers. What’s your win rate? What’s your average risk-to-reward?
This work is invaluable. It forces you to be objective and gives you a genuine feel for the strategy's rhythm, building a plan based on evidence, not hope.
Trading the Double Top with MyFundedCapital
Knowing how to trade a double top is a skill. Successfully applying it with discipline is what prop firms like MyFundedCapital look for. The pattern's clear structure helps you manage risk effectively, which is essential for trading on our platform.
The double top tells you where you’re wrong—any sustained move above the peaks. Placing your stop-loss just above that high gives you a hard, quantifiable risk for every trade. This makes it straightforward to adhere to our 5% daily loss limit, a key rule for all our funded traders.
Finding Setups Across All Our Markets
With MyFundedCapital, you have the freedom to hunt for double tops across 350+ instruments on platforms like DXtrade and cTrader. This means you can be selective, waiting for only the best setups to come to you:
- Find a textbook double top on EUR/USD.
- Pinpoint a reversal on the US30 index.
- Catch a shift in momentum on BTC/USD.
This variety is a huge advantage. You aren't forced to take mediocre trades; you can scan the entire market for A+ opportunities. For swing traders, our optional weekend holding add-on lets you hold positions over the weekend, so you don’t have to cut a potentially big winner short.
As you gain experience, you might automate your strategy. We fully support algorithmic trading, allowing you to build an Expert Advisor (EA) in cTrader to scan for your exact double top criteria 24/7. Mastering patterns like the double top is how you prove you have what it takes to pass a Challenge and earn consistent payouts with profit splits up to 100%.
Ready to apply your strategies in a professional trading environment? Learn more about our funding programs and find the account that’s right for you.
Frequently Asked Questions (FAQ)
What is the difference between a double top and simple resistance?
Simple resistance is just a price level where an uptrend has stalled. A double top is a more developed pattern: it involves a second failed attempt at that resistance level, often on weaker volume, followed by a decisive break below the "neckline" support level formed between the two peaks. The neckline break is the key confirmation of a potential bearish reversal.
What if the second peak is slightly higher or lower than the first?
It's rare for both peaks to be at the exact same price. A second peak that is slightly lower is a stronger sign of weakness. A second peak that is slightly higher can sometimes be a "bull trap" before the reversal, but it's essential to wait for the neckline break as confirmation before acting on it. The key is that the general price area holds as resistance.
Can I trade the double top on lower timeframes like the 1-minute chart?
You can, but be cautious. The pattern appears on all timeframes, but its reliability is much lower on shorter ones (e.g., 1-minute, 5-minute). These charts have more "noise" and false signals. The double top is significantly more robust and trustworthy on higher timeframes like the 4-hour, daily, and weekly charts.
Ready to put your pattern-trading skills to the test in a professional environment? At MyFundedCapital, we provide the simulated capital and supportive conditions you need to succeed.
Compare our funding programs and start your trading journey with us today.
