

 AR
AR
 NL
NL
 EN
EN
 FR
FR
 DE
DE
 ES
ES
 IT
IT
 PL
PL
 SV
SV


Understanding Fibonacci retracements can seem complex, but they are a powerful tool for identifying potential entry and exit points in a trending market. This guide will show you exactly how to draw and interpret these levels correctly, turning theory into actionable trading steps. You'll learn the practical 'how' and the critical 'why' behind this popular technical analysis tool.
Why Fibonacci Retracements Matter in Trading
When a market makes a strong move and then pulls back, traders use Fibonacci levels to anticipate where that pullback might stop and reverse. These levels—23.6%, 38.2%, 50%, 61.8%, and 78.6%—act as potential support or resistance zones. It’s a method of identifying high-probability areas where a trend might resume.
This isn’t about a magic formula. The power of Fibonacci comes from its widespread use. When thousands of traders, from retail investors to institutional algorithms, are all watching the same key levels, their collective actions can create a self-fulfilling prophecy.
The Psychology Behind Key Levels
Imagine a currency pair like EUR/USD rallies strongly. As the price begins to dip, traders who missed the initial move look for an opportunity to buy, while those who profited from the rally consider where to take profits. Fibonacci levels provide a shared map for both groups.
- 38.2% and 50%: These are often the first major support levels in a pullback. A bounce here signals a very strong trend, as buyers are eager to get back in.
- 61.8%: Known as the "Golden Ratio," this is the most-watched level. A pullback to this point is considered a significant but healthy correction, often seen as a prime entry point for the trend to continue.
The secret to Fibonacci isn't mystical math; it's mass psychology. A level becomes important simply because a critical mass of traders believes it's important and acts on that belief.
Building a Foundation for Confident Trading
Understanding this psychological element is the first step to using the tool effectively. Simply applying lines to a chart without knowing the why is just guessing. When you see these levels as zones of potential supply and demand, they become a powerful part of your trading strategy.
This is especially true when managing risk in a funded account with a prop firm. On platforms like cTrader, DXtrade, or Match-Trader, using Fibs helps pinpoint entries, set logical stop-losses, and define clear profit targets. Mastering the tool correctly adds confidence and discipline to your trading plan. Remember, all trading involves the risk of loss, and this guide is purely for educational purposes and not financial advice.
Getting The Anchors Right: How To Draw Fibonacci Retracements
Now for the practical application. The entire technique of drawing Fibonacci retracements correctly depends on one thing: picking the right swing high and swing low.
Getting these two anchor points right is 90% of the battle. If you misplace them, every level the tool generates will be inaccurate and useless for making sound trading decisions. This is the most common mistake new traders make.
Identifying Your Anchor Points
To draw accurate Fib levels, you need to identify a clear, significant price move to measure. Look for an obvious swing low (the bottom of a move up) and a swing high (the top of that move). Ignore the minor noise in between.
You are looking for a distinct, powerful leg of price action that stands out on the chart. Once you've found it, you have your two anchor points.
For a deeper dive into this crucial first step, this professional guide on How To Draw Fib Retracements: A Professional Trader's Guide is a fantastic resource.
Drawing Retracements In An Uptrend
In an uptrend, the market makes a series of higher highs and higher lows. Your goal is to measure the most recent major upward move to predict where the pullback might find support.
Here is a step-by-step checklist:
- Step 1: Select the Fibonacci Retracement tool from your trading platform's toolbar.
- Step 2: Identify the start of the major upward move and click on the Swing Low.
- Step 3: Drag your cursor to the peak of that same move and click on the Swing High.
The platform will automatically overlay the key Fibonacci levels (23.6%, 38.2%, 50%, 61.8%, etc.) between these two points. You then watch to see if price pulls back to one of these levels before resuming the uptrend.
Key Takeaway: In an uptrend, you always draw from low to high.
Drawing Retracements In A Downtrend
In a downtrend, the process is simply reversed. The market is making lower lows and lower highs, and you want to measure a downward move to find where a relief rally might hit resistance.
Here is the process:
- Step 1: Select the Fibonacci Retracement tool.
- Step 2: Click first on the Swing High where the downward move began.
- Step 3: Drag your cursor down and click on the Swing Low at the bottom of that move.
The tool projects the key levels onto your chart. In this scenario, you're looking for price to bounce from the low and get rejected at a Fib level, setting up a potential entry to continue the downtrend. For more ideas on combining tools, see our guide on technical analysis trading tips and charting trends.
This simple three-step mindset—pinpointing the trend, identifying the pivots, and trading with confidence—is what turns this tool into a reliable part of your strategy.
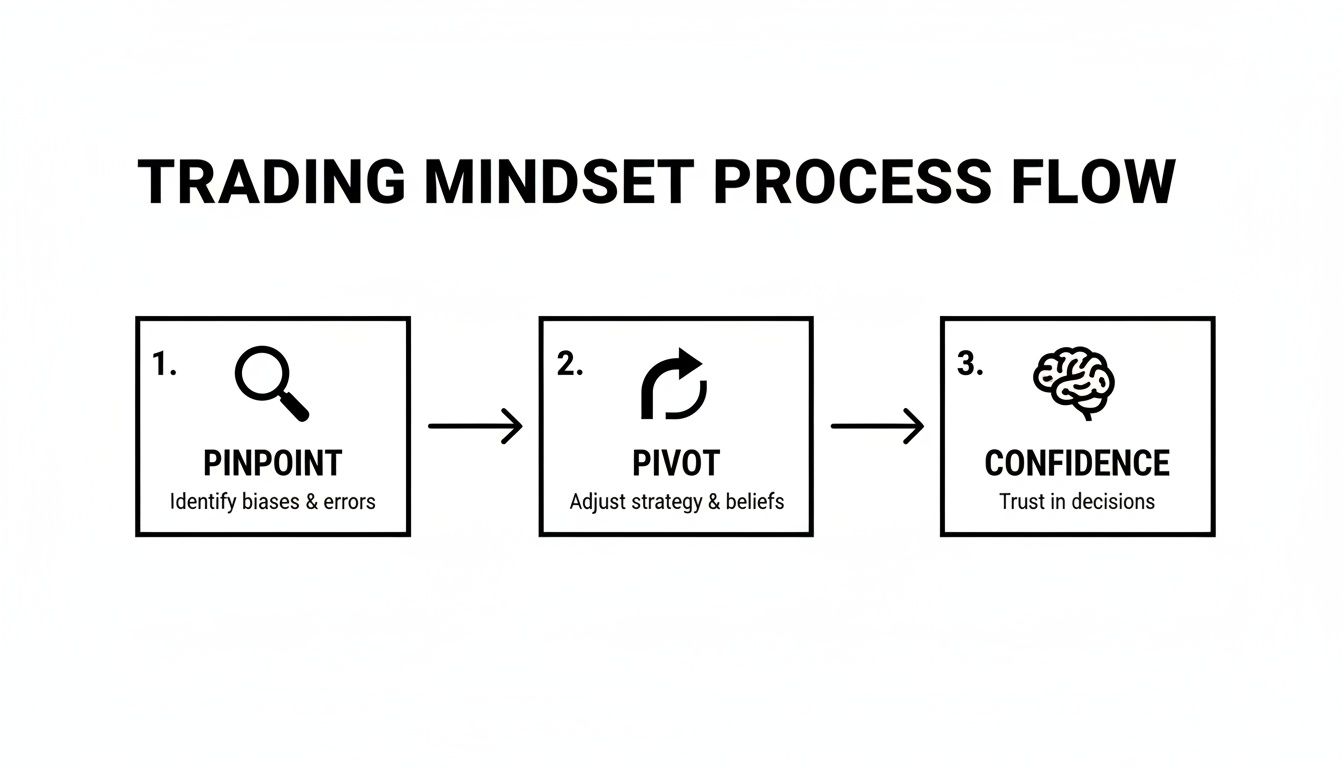
This flow is what helps build the conviction you need to actually act on the levels when the time comes.
Key Fibonacci Retracement Levels and Their Significance
Understanding what each level represents is just as important as drawing them correctly. While price can react at any level, some carry more weight than others.
The table below breaks down the most common levels and what they typically signal about the market's strength and sentiment.
| Fibonacci Level | Type of Retracement | Common Interpretation & Trader Action |
|---|---|---|
| 23.6% | Shallow | A very shallow pullback. Often indicates a strong trend that may not offer a deep entry. |
| 38.2% | Moderate | A common and significant level. Considered a solid area for a trend-continuation entry. |
| 50.0% | Medium | Not an official Fibonacci ratio, but widely watched. Represents a 50% giveback of the prior move. |
| 61.8% | Golden Ratio | The most critical level. A bounce from here is seen as a high-probability trend-continuation setup. |
| 78.6% | Deep | A very deep retracement. A bounce here is the "last chance" for the trend to continue; a break often signals a reversal. |
These levels provide a framework, helping you gauge whether a pullback is a healthy correction or the start of a trend reversal.
Turning Fibonacci Levels into Actionable Trades
Drawing the lines is the easy part; the real skill is creating a concrete trading plan from them. The key levels—23.6%, 38.2%, 50%, 61.8%, and 78.6%—are potential action zones. Your job is to interpret the price action at these levels and find a trade where the risk-reward is favorable.
This isn’t about blindly setting an order at a specific line. It’s about waiting for the market to confirm your analysis, then acting with a clear plan for your entry, stop loss, and take profit.
Interpreting Shallow vs. Deep Pullbacks
The depth of a retracement offers clues about market sentiment.
- Shallow Retracements (23.6% & 38.2%): When price only pulls back to these first levels before resuming the trend, it signals immense strength. Buyers are not waiting for a bigger discount.
- Medium Retracements (50%): Though not an official Fibonacci ratio, the 50% level is a powerful psychological midpoint. A bounce here suggests a healthy, balanced trend.
- Deep Retracements (61.8% & 78.6%): These are make-or-break levels. The 61.8% golden ratio is the most-watched level. A strong reaction here is a classic trend-continuation signal. If price reaches the 78.6% level, it is often the trend's last line of defense.
The 61.8% Fibonacci retracement is a powerhouse. Prices have shown an incredible tendency to react at this "golden retracement." During the 2008 financial crisis, for instance, the Dow Jones Industrial Average retraced almost perfectly to the 61.8% level of its entire 2007-2009 decline before staging a massive recovery. This isn't just a stock market phenomenon; you see similar behavior in FX and crypto, making it a critical level to watch.
You can find more details on common Fibonacci applications and mistakes in this insightful guide on Fibonacci retracements.
Building a Concrete Trading Plan
Once you identify a key Fibonacci level, you need an actionable plan. Let’s walk through a hypothetical example for a GBP/JPY trade.
Scenario: GBP/JPY rallies from 198.50 to 201.50. You draw your Fib levels from the swing low to the swing high. Price pulls back and approaches the 61.8% retracement level at 199.65.
Here’s how you could structure a trade based on this information:
- Define Your Entry Trigger: Do not place a blind buy limit order at 199.65. Wait for confirmation, such as a bullish candlestick pattern (e.g., a hammer or engulfing candle) to form at the 61.8% level. Your entry is triggered after the market confirms the level is holding.
- Set a Logical Stop Loss: Place your stop loss below the Fibonacci level to avoid a premature exit. A common approach is to place it just below the next level down. In this example, with an entry near 61.8%, a stop loss just below the 78.6% level would be a logical choice. This defines your risk before you enter.
- Establish Profit Targets: Your targets should offer a favorable risk-to-reward ratio. A first target could be the recent swing high (the 0% line). Further targets can be projected using Fibonacci extension levels (like 127.2% or 161.8%). Always calculate your risk-reward ratio for every setup.
Remember, this is a framework, not a rigid set of rules. The goal is to combine Fibonacci levels with disciplined risk management. Trading always involves the risk of loss, and these strategies are for educational purposes only.
Real-World Chart Setups and Trading Scenarios
Theory is one thing, but execution in a live market is another. Let's analyze actual trading setups to see how Fibonacci levels perform under pressure. We will look at both winning and losing examples to understand why simply seeing price touch a level is rarely enough to enter a trade.
The goal is to move past the basics and learn how to stack probabilities in your favor. When you combine Fibonacci levels with other signals, you can pinpoint high-conviction "confluence zones" that give you a much stronger trading edge.
The Power of Confluence Zones
A confluence zone is an area on your chart where multiple technical signals converge. A single Fibonacci level is a clue; a Fibonacci level that aligns with other indicators is a high-probability setup.
Here are a few powerful confluence signals to look for:
- Fibonacci + Moving Averages: A 50% retracement level that perfectly aligns with the 50-period moving average creates a powerful dynamic support zone.
- Fibonacci + Previous Structure: If the 61.8% golden ratio lines up with a previous swing high or low, that area becomes a magnet for price. Old resistance often becomes new support.
- Fibonacci + RSI: A pullback to the 38.2% level in an uptrend is more compelling if the RSI indicator is simultaneously showing an "oversold" reading (e.g., below 30).
By waiting for confluence, you automatically filter out weaker setups. You shift from a reactive approach to a proactive strategy of identifying zones where a market turn is most likely.
Analyzing a Successful Trade Setup
Let's break down a trend-continuation trade on the EUR/USD 4-hour chart.
Scenario: EUR/USD moves up from 1.0700 to 1.0850. The trend is clearly bullish. You draw your Fibonacci tool from the 1.0700 swing low to the 1.0850 swing high.
Price pulls back towards the 61.8% golden ratio around 1.0757. A quick check shows this exact point was a resistance level two weeks ago—a clear confluence zone. Instead of entering immediately, you wait for confirmation. A bullish engulfing candle forms at the level, signaling that buyers have stepped in.
- Entry: Go long at the close of the bullish candle, around 1.0765.
- Stop Loss: Place your stop just below the 78.6% level, around 1.0730.
- Profit Target: The initial target is the recent swing high at 1.0850, offering a risk-to-reward ratio well over 1:2.
This setup worked because it combined a Fib level, historical market structure, and a clear price action signal. For more on patterns, our guide on chart patterns in Forex is a great next step.
Examining a Failed Setup
Learning from losing trades is just as important. Let's look at a scenario where a Fib level failed.
Scenario: Gold (XAU/USD) is in a downtrend, falling from $2,350 to $2,300. You draw your Fibs from the high to the low, looking for a place to short the pullback.
Price rallies to the 50% retracement at $2,325. You place a sell limit order there. However, price slices right through it with a large bullish candle and continues to the 61.8% level, doing the same thing.
The trade failed because it was based on a single indicator without any confirmation. There was no bearish price action and no confluence. This highlights a critical rule: Fibonacci levels are potential zones, not guaranteed barriers. If the market is ignoring a level, you must adapt.
History backs this up. Fibonacci retracements are known to be especially effective at predicting support during uptrends, with studies showing the 38.2% and 50% levels holding bounces 65-72% of the time in major indices like the S&P 500. It’s all about combining these levels with the broader market context. You can see more on using Fibonacci levels from this analysis.
Common Mistakes to Avoid with Fibonacci Retracements

Knowing how not to use Fibonacci retracements is just as important as knowing how to draw them. New traders often make avoidable errors that lead to costly mistakes. Most of these mistakes come from either misusing the tool or expecting too much from it.
Applying Fibs in Choppy or Ranging Markets
This is the biggest mistake traders make. Fibonacci retracements are a trend-following tool. Their purpose is to identify pullback zones within an established trend. If the market is moving sideways, your Fib levels are misleading.
- The Problem: In a ranging market, there are no clear higher highs or lower lows to measure. Drawing a Fib from a random peak to a valley inside this chop creates arbitrary lines.
- The Fix: Before using the tool, ask: "Is there a clear, directional trend on this timeframe?" If the answer isn't a firm "yes," do not use it.
Selecting Insignificant Swing Points
The accuracy of your Fibonacci levels is 100% dependent on the anchor points you choose. If you anchor your tool to minor wiggles in the price, the resulting levels will be insignificant.
You must anchor your tool to the major, obvious pivot points that define a significant leg of the trend. These are the moves that command the attention of the broader market.
A common trap is "curve fitting"—forcing a Fib onto a small move because the levels happen to line up with a recent bounce. This is confirmation bias and will lead to poor results. Stick to the most obvious swings on the chart.
Relying on Fib Levels as Infallible Signals
Fibonacci levels are areas of interest, not guaranteed reversal points. Placing blind limit orders on a Fib level without waiting for confirmation is a low-probability strategy.
- The Problem: Entering a trade just because price touched a line is gambling.
- The Fix: Always wait for price action confirmation. Look for a clear candlestick pattern—like a rejection wick, a hammer, or an engulfing candle—to form at your Fib level. This is your signal that other traders are defending the level.
Successful trading is about managing risk and putting probabilities on your side. Avoiding these common mistakes is a massive step in that direction. Remember, all trading involves the risk of loss, and this content is for educational purposes only.
FAQ: Common Questions About Fibonacci Retracements
Here are answers to some of the most common questions traders have when learning how to draw Fibonacci retracements.
Can I use Fibonacci retracements on any timeframe?
Yes, the principles of Fibonacci work on all timeframes, from one-minute charts to weekly charts. However, levels on higher timeframes (4-hour, daily, weekly) are generally more reliable because they are based on more significant price moves that a larger number of traders are watching.
What is the difference between Fibonacci Retracements and Extensions?
This is a key distinction.
- Retracements are used to find potential entries during a pullback in a trend. They measure how far price has pulled back within a move.
- Extensions are used to set potential profit targets. They project where price might go if the trend continues after the pullback. Common extension levels are 127.2% and 161.8%.
In short: Retracements are for getting in a trade, and extensions are for getting out.
How do I know if price will respect a Fibonacci level?
You don’t know with 100% certainty. Trading is about probabilities, not guarantees. Instead of trying to predict, wait for the market to give you confirmation. Look for clues like:
- Price Action Confirmation: A bullish or bearish candlestick pattern forming at the level.
- Confluence: The Fib level aligns with another technical indicator, like a moving average or a previous support/resistance zone.
If price moves through a level without pausing, the market is telling you that the level is not significant. Listen to it.
Is the 61.8% level always the best entry point?
The 61.8% "golden ratio" is highly respected, but it’s not always the "best" entry. The ideal level depends on the market's context. In a very strong trend, price may only pull back to the 38.2% level before continuing. Being flexible and using the levels as a guide, rather than a rigid rule, is key.
You now have the knowledge to draw Fibonacci retracements, interpret the levels, and avoid common pitfalls. The next step is practice. At MyFundedCapital, we provide the platform and capital for traders ready to apply their skills.
Explore our funding programs to find the right challenge or instant funding account to start your journey.
