You've probably done this already. You backtested a strategy, saw a clean equity curve, and started thinking about challenge rules, payouts, and scaling. Then one ugly losing streak hits in replay or demo, and suddenly the backtest doesn't feel solid anymore.
That gap is where an equity curve simulator earns its keep. It won't predict the future, but it will show you how fragile or durable your strategy might be when trade order turns against you, and that matters a lot when you're trading under prop firm loss limits. Trading involves risk of loss. This article is educational only, not financial advice.
What an Equity Curve Simulator Reveals About Your Strategy
You pass six straight trading days in a demo, then hit a four-loss stretch on day seven and start doing dangerous things. You cut winners early. You skip valid setups. You increase size to catch back up. That sequence matters more in a prop challenge than a pretty backtest report, because firms judge the path your equity takes, not just the endpoint.
An equity curve simulator shows how your strategy behaves when the trade order changes but the underlying edge stays the same. That is the point. A backtest records one historical sequence. A simulator tests whether the same system still holds together when winners come later, losses cluster early, or variance shows up at the worst possible time.
One backtest can hide a lot
Many newer traders overtrust the order of historical trades. If the strong winners appear early, the curve looks stable and confidence rises fast. Put a losing streak at the start instead, and that same strategy can feel untradable even if the expectancy has not changed.
That is why simulation matters. You input the basic traits of the system, usually win rate, average win, average loss, risk per trade, and trade count, then randomize the sequence across many runs. The goal is not to predict next week. The goal is to see the range of pain your method can produce while still being a valid method.
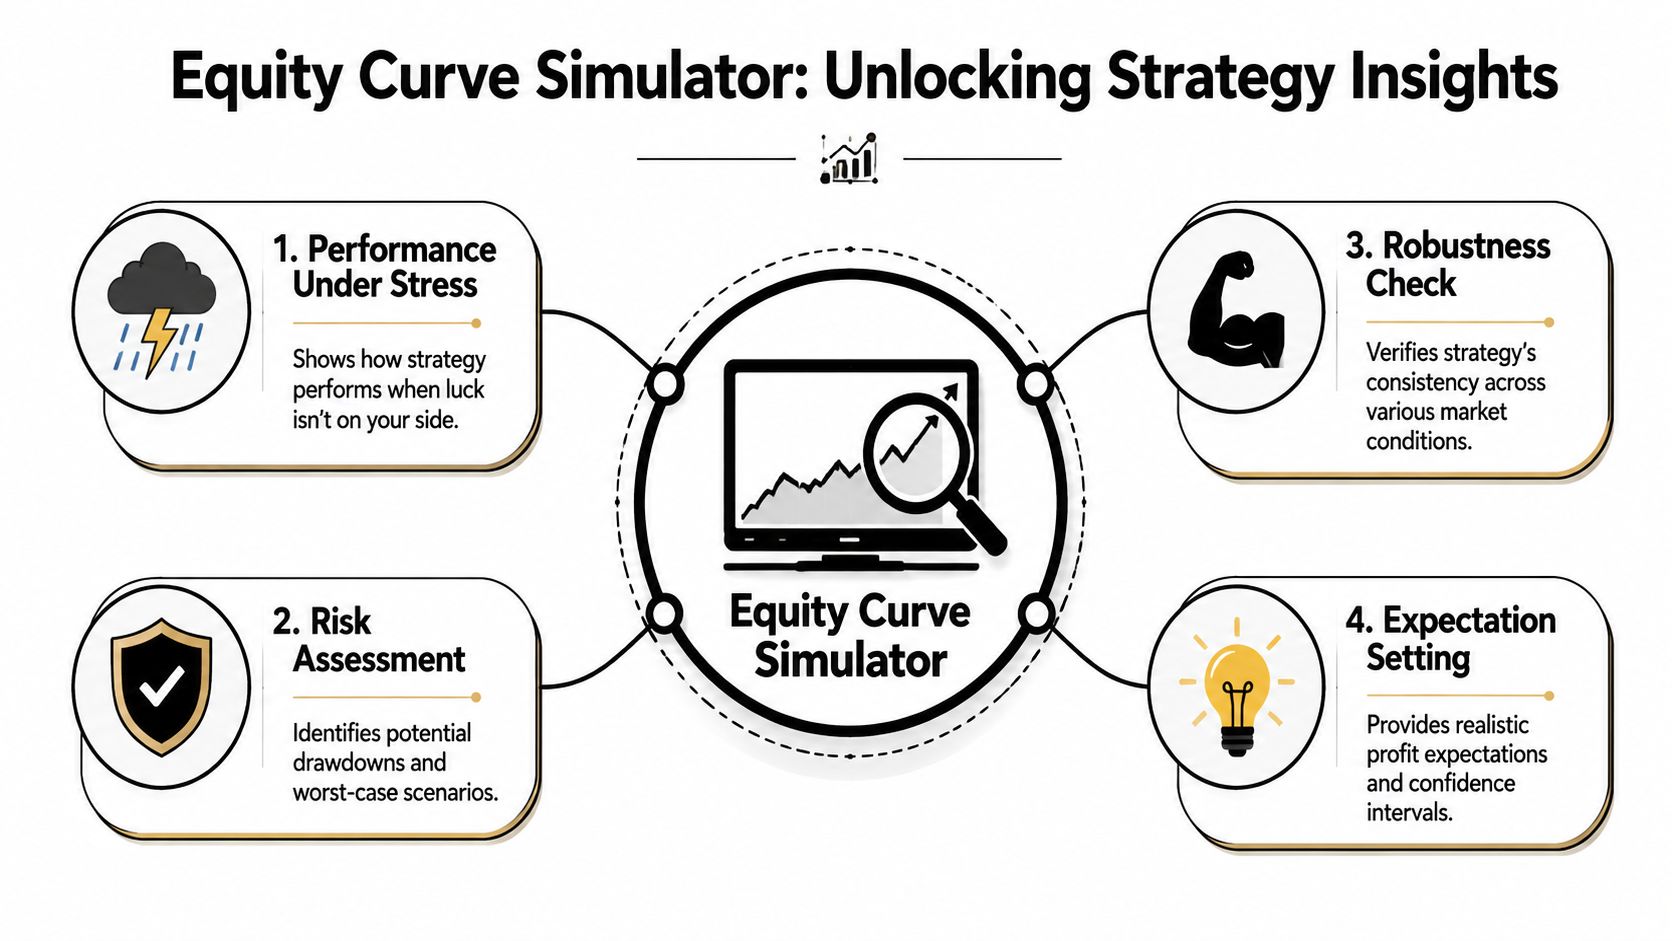
A useful simulator surfaces questions traders usually avoid until live money is on the line:
- How deep can drawdowns get? Clusters of normal losses often look much worse than a clean backtest suggests.
- How long can a bad stretch last? A strategy with solid expectancy can still produce a losing run that breaks discipline.
- What does a normal outcome range look like? This helps separate ordinary variance from a genuine strategy failure.
- What happens if you change size? Small increases in risk per trade can turn a manageable drawdown into a challenge-ending event.
Practical rule: If a strategy only works emotionally or financially when trades arrive in a friendly order, it is not ready for funded evaluation.
Why this matters before a prop challenge
Confusion between expectancy and readiness punishes traders. A system can be profitable on paper and still be a poor fit for a prop firm if the likely drawdown path collides with daily or overall loss limits.
I treat simulation as a screening step before paying any evaluation fee. With firms such as MyFundedCapital, the question is not just whether your strategy can make money. The question is whether it can stay inside the account rules while variance does what variance always does. That starts with a clear understanding of equity in trading, because prop rules are enforced on equity movement, not your intentions.
There is another practical benefit. Simulation separates strategy validation from idea collection. If you are still building a playbook, it may help to find trade idea platforms that fit your market and time frame. Once you have a repeatable setup, though, the main job is pressure-testing the risk profile.
What it does not do
A simulator will not certify your edge. It will not model every execution mistake, every news shock, or every discipline error.
What it does well is expose your failure mode. That is the part traders need before a challenge. If the simulated paths show that an ordinary losing streak is enough to push you near a rule breach, the strategy needs smaller size, better trade selection, or more work before it sees a funded account.
Preparing Your Strategy's Raw Data for Simulation
A simulator is brutally honest about one thing. Bad inputs produce bad outputs.
If your journal is sloppy, if your backtest skipped difficult periods, or if your averages come from a tiny sample, the simulation will still give you charts. They just won't mean much.
Pull the right metrics from your journal
You don't need dozens of variables to start. You do need clean ones.
Build your input sheet around these:
- Win rate: Total winning trades divided by total trades.
- Average win: Your mean gain on winners. Many traders prefer expressing this in R.
- Average loss: Your mean loss on losing trades, also best tracked in R.
- Risk per trade: The amount of account risk you plan to apply to each position.
- Trade count: How many trades the system typically produces over the period you care about.
R-multiples help because they normalize results. A gain of 2R means the trade earned twice what you risked. A loss of 1R means you lost your predefined risk amount. That makes systems easier to compare and simulate.
Sample size matters more than most traders think
A lot of traders try to simulate off a small set of trades that happened during favorable conditions. That's one of the fastest ways to fool yourself.
Industry guidance on equity curve simulation notes that these tools are usually built from inputs such as win rate, risk-reward ratio, risk per trade, and number of trades, and many tools recommend at least 500 to 1,000 trades for a more reliable picture than a small sample of 100 trades. The same guidance also says your inputs should ideally come from at least 100 real trades taken from a journal or validated backtest to reduce skew, according to QuantVPS on using an equity curve simulator.
A simulation doesn't clean your data. It magnifies whatever truth or distortion is already inside it.
A practical prep checklist
Before you run anything, verify these points:
- Include every trade: Don't remove scratches, partials, or ugly mistakes if they reflect how you trade.
- Use realized averages: Don't plug in your “target” reward if your journal shows you routinely cut winners early.
- Separate strategy variants: Breakout trades and mean-reversion trades shouldn't be mixed if they behave differently.
- Check trade frequency: A strategy that trades often behaves differently from one that sits for long periods.
- Review the source period: If the data came from a backtest, make sure it wasn't optimized into perfection.
Keep the dataset boring
That sounds strange, but it's the right goal. Clean simulation data should be dull, standardized, and repeatable. If your spreadsheet looks like a highlight reel, it's probably not ready.
Use a journal export or validated backtest report, then map those numbers into a simple simulator input sheet. If your backtesting process still needs work, this guide on how to backtest trading strategies is the right place to tighten the foundation before you simulate.
The Simulation Process From Trades to Curves
A trader finishes a backtest, sees a healthy expectancy, and assumes the challenge should be straightforward. Then the first week of a prop evaluation delivers four losses in a row, the daily drawdown gets tight, and the strategy suddenly feels untradeable. That gap between a good system on paper and a tradable path in a funded challenge is exactly why simulation matters.
An equity curve simulator converts trade stats into many possible account paths. The math is simple. The decision-making value is not. For prop firm preparation, a key question is never just whether the strategy has an edge. It is whether the edge can survive a bad sequence without violating the account rules.
The basic flow
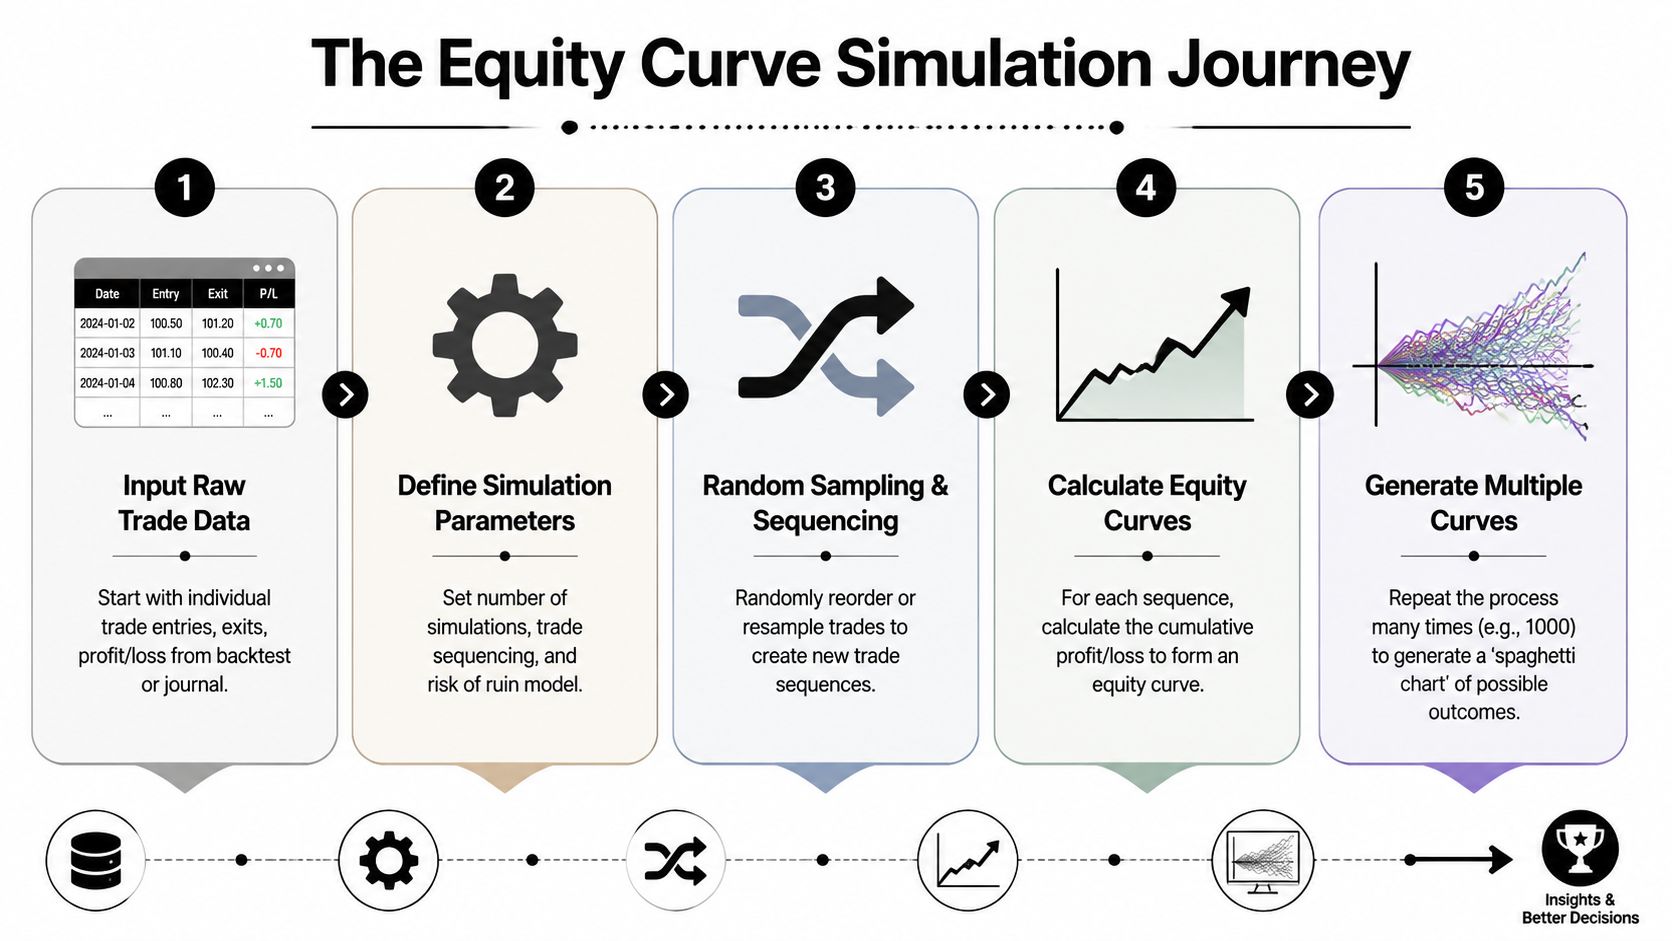
The workflow is straightforward:
Enter the core trade inputs
Use actual win rate, average win, average loss, and expected number of trades. Then choose the sizing method you will really use, such as fixed dollar risk or percentage risk.Set the run length
Match the simulation horizon to the decision in front of you. If you are testing readiness for a prop challenge, use a trade count and time window that resembles the evaluation period.Randomize the trade order repeatedly
The simulator reshuffles wins and losses across many runs so you can see how much sequence alone changes the result. Same edge. Different path.Build the equity curve for each run
Every simulated sequence produces a balance line. Some paths trend cleanly. Others spend a long time underwater before recovering. Some never recover within the test window.Review the range of outcomes
One attractive curve proves nothing. A cluster of ugly but plausible curves tells you far more about whether the strategy fits your risk limits.
What the simulator is actually testing
The simulator is not predicting market direction. It is testing how fragile or durable your strategy becomes once randomness hits the order of outcomes.
That distinction matters. Two systems can have the same expectancy and still behave very differently in a challenge account. One may recover quickly from losing streaks. Another may hit a maximum drawdown threshold early because losses arrive in the worst possible order.
This is why I care more about path dependency than headline expectancy when evaluating a prop plan. If MyFundedCapital rules leave little room for a rough opening sequence, then the sequence risk is part of the strategy, not a side issue.
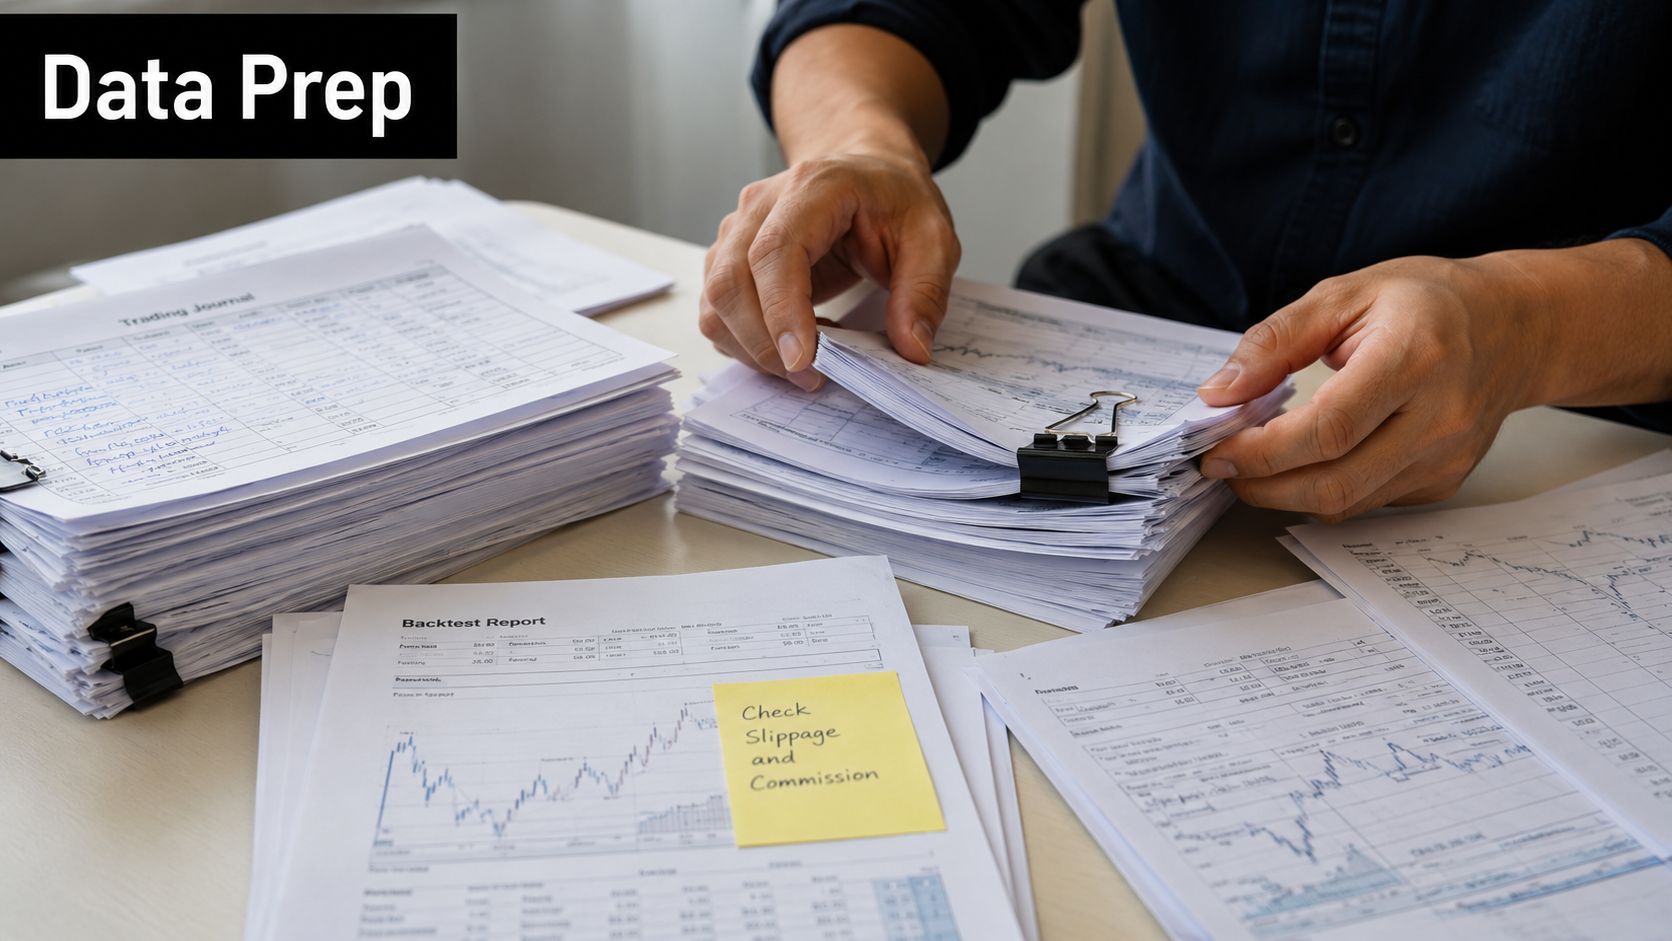
Friction belongs in the model
Clean assumptions produce misleading curves.
If the strategy pays commissions, model them. If entries slip in fast conditions, add slippage. If overnight holds create swap or financing costs, include them. If you know from your journal that you occasionally miss valid entries or cut trades early, keep the assumptions conservative enough to reflect that behavior.
Many traders build a simulator around ideal execution, then wonder why live results feel harsher. The reason is simple. They tested the edge and ignored the operating conditions.
Sizing changes the curve more than newer traders expect
Position sizing is not a cosmetic setting. It changes the shape of the whole distribution.
A fixed-risk model makes runs easier to compare because each trade risks a similar amount in cash terms. A compounding model is closer to how many traders scale, but it also makes drawdowns and recovery rates more path-dependent. Early losses reduce size. Early wins increase exposure. That can help or hurt depending on the order of trades.
For prop firm challenges, I usually want the simulation to mirror the exact sizing plan intended for the evaluation. If the trader plans to risk a steady fraction per trade under MyFundedCapital rules, then that is the model to test. Using one sizing method in simulation and another in the live challenge creates false confidence, and false confidence gets expensive fast.
Analyzing Simulation Outputs Like a Professional Trader
Once you have a screen full of simulated curves, the temptation is obvious. You look for the average gain or the prettiest ending balance.
That's amateur analysis.
Professional traders look first at the ugly parts. They care about whether the account survives a bad sequence, whether the drawdown is tolerable, and whether the strategy still makes sense when luck isn't helping.
Start with the tails, not the middle
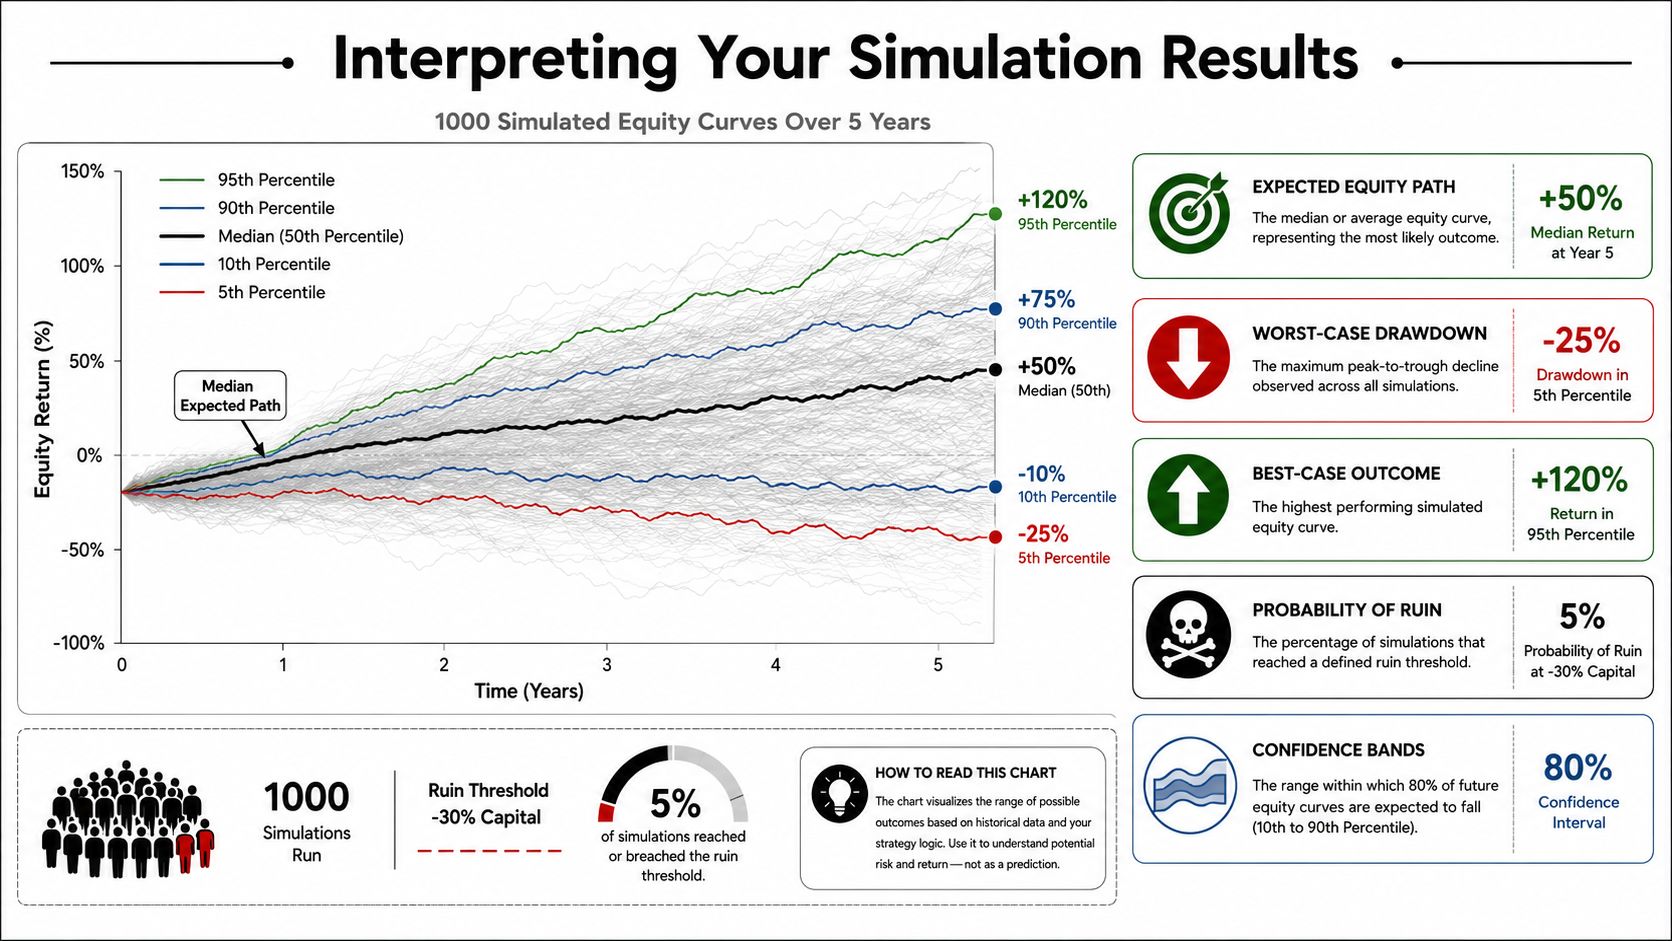
For risk work, the most useful outputs are the parts of the distribution that show stress. Trade-focused simulators commonly highlight probability of profit, risk of ruin, and 95th-percentile max drawdown, along with losing-streak frequency and ruin-threshold analysis such as 30%, 50%, or 70% drawdown, according to TradeZella's Monte Carlo simulator guide.
Those numbers matter more than the mean because challenge failure usually comes from the tail, not the average.
Here's how I'd prioritize the readout:
| Output | Why it matters |
|---|---|
| 95th-percentile max drawdown | Shows how bad the drawdown can get in tougher but still plausible paths |
| Risk of ruin | Tells you how often the account reaches a defined failure threshold |
| Probability of profit | Useful, but only after confirming the downside is survivable |
| Losing streak frequency | Helps you prepare for the emotional and rule-based pressure of clustered losses |
What a spaghetti chart should tell you
When you see many curves layered together, don't ask whether they all end higher. Ask how widely they spread and how violently they dip.
A tight cluster suggests the system's path is relatively stable under random sequencing. A wide fan suggests sequence sensitivity. That doesn't always mean the edge is bad. It may mean your sizing is too aggressive for the edge you have.
Look for these clues:
- Large early dispersion: The system may be vulnerable at challenge start.
- Repeated deep troughs: Position sizing may need to come down.
- Long flat recoveries: Psychologically hard systems often fail even when mathematically viable.
- A few standout winners with many mediocre paths: The average may be hiding dependence on favorable sequencing.
If your simulation says the strategy survives but your temperament won't, the setup is still unusable.
Losing streaks deserve special attention
Many traders think they can handle a rough patch until they hit one. Simulation gives you a way to rehearse that pain before money or challenge fees are on the line.
If a profitable system can still generate long clusters of losses, you need answers to practical questions:
- Will you keep taking valid setups?
- Will your daily risk cap force you to stop before the edge plays out?
- Will you reduce size mid-drawdown and distort the plan?
- Will you abandon the strategy at the worst possible time?
That's where simulation becomes a psychological tool, not just a math tool.
Read drawdown in account terms
This part is critical for challenge traders. Drawdown is not just a chart dip. It's the distance between your process and a hard rule breach.
Translate the output into language you can act on:
- “Can I tolerate this drawdown without changing behavior?”
- “Would this streak put me near my account stop?”
- “Does this profile fit my style, or am I forcing a high-variance system into a low-tolerance environment?”
For a better frame on this, review how maximum drawdown works in practical trading terms. Once you start reading simulation outputs through a drawdown lens, the average return stops being the headline.
Applying Simulation Results to Prop Firm Rules
An equity curve simulator then stops being academic and starts becoming useful.
Prop challenges don't care that your strategy has positive expectancy over the long run. They care whether you can stay inside the rules today, this week, and through a rough sequence of trades. A strategy can be profitable and still be a terrible fit for a challenge account if its normal drawdown profile is too wild.
Convert strategy risk into rule risk
Take the challenge rules and turn them into simulation questions.
For example, if the account has a 5% daily loss limit and up to 10% maximum drawdown, don't ask whether your strategy “usually wins.” Ask sharper questions:
- What kind of losing streak would push my daily loss too close to the limit?
- If several losses land early in the evaluation, can I continue trading the plan without breaching the account?
- Does my normal drawdown profile fit under the maximum drawdown rule with room for execution noise?
- If I hit a cold patch, do I have enough buffer left to let the edge play out?
Those two challenge numbers come directly from the published account rules described by MyFundedCapital in the publisher brief. They're useful because they force discipline. They also expose weak sizing very quickly.
Use the simulator before you pay the fee
A lot of traders approach a challenge backward. They buy the account first, then discover whether their sizing model fits the rules.
Do it the other way around.
Run the simulation using the same risk model you plan to use in the challenge. Then compare the output against the rule structure. If the distribution shows regular drawdowns that sit too close to the account limits, the fix usually isn't “trade better.” The fix is smaller size, fewer correlated trades, or a different setup.
A practical review looks like this:
- Green light: Simulated drawdowns leave meaningful room under the rule limits.
- Yellow light: The edge may be valid, but one rough cluster could put the account under pressure.
- Red light: The strategy might work in a personal account but is structurally misaligned with challenge rules.
The real edge is knowing your failure mode
Passing a challenge is not just about finding profit. It's about avoiding predictable disqualification.
That's why the simulator matters so much here. It helps you identify the exact behavior that can fail the account:
- Oversizing after a few winners
- Taking too many trades in one session
- Letting correlated positions stack risk
- Running a strategy whose normal variance is too high for fixed limits
If your simulation says a bad but plausible sequence can push you near the line, believe it. Don't assume discipline alone will rescue bad risk structure. Good challenge traders aren't just skilled at entries. They use strategies whose equity behavior fits the account rules.
Common Simulation Pitfalls and How to Avoid Them
A trader runs a clean-looking simulation, likes the upward curve, and starts a prop challenge with full confidence. Ten trading days later, the account is gone. The strategy did not suddenly stop working. The simulation was built on assumptions that were too generous for live conditions and too loose for challenge rules.
That happens more often than traders admit, especially when the goal is passing a firm with fixed loss limits. With MyFundedCapital or any similar evaluation, a simulation is only useful if it reflects the conditions that can fail the account.
The usual problems
- Tiny sample inputs: A small trade sample hides ugly streaks. Twenty or thirty trades can make a strategy look far smoother than it is. Use a larger sample that includes wins, losses, flat periods, and mistakes you are likely to repeat under pressure.
- Ignoring market regimes: A setup that behaves well in a steady trend can break down in chop, low liquidity, or event-driven volatility. Split your trade history by condition and test each group separately before you combine them.
- Overfitted assumptions: Traders often "clean up" the numbers by lifting win rate, tightening average loss, or removing bad execution. That turns the simulator into a sales pitch. Use realized results, including sloppy fills and ordinary decision errors.
- No cost modeling: Commissions, spread, slippage, and swap matter. A strategy with a thin edge can survive on paper and fail in a challenge account once those costs are included.
- Too few iterations: If you run only a small number of simulations, the ugly tail outcomes may never show up. Run enough iterations to see whether rare loss clusters would still fit inside your challenge limits.
The fixes that actually help
Start with the raw inputs. Check whether the journal includes partial exits, break-even trades, missed stops, and trading costs. If the trade log is sanitized, the simulation will be sanitized too.
Then pressure-test the assumptions.
- Audit the source data: Use journal exports or a backtest you have already verified against market replay or live execution.
- Round against yourself: If average slippage is uncertain, assume it is slightly worse. If win rate varies by session, use the weaker session number unless you will trade only the stronger one.
- Separate regime behavior: Test trend days, range days, news-heavy sessions, and quiet sessions. A blended average can hide the exact condition that breaks the account.
- Match the live plan: Use the same sizing method, trade frequency, and correlation exposure you plan to use in the challenge.
One more mistake deserves its own warning. Traders simulate the strategy, but not their behavior. If you tend to increase size after a winning streak, revenge trade after a sharp loss, or stack positions on the same market theme, include that behavior in a stress version of the test. For prop firm prep, that version is often more informative than the polished base case.
The simulator should make the strategy harder to approve, not easier. If it still clears the rules after conservative inputs and ugly sequencing, then it is doing its job.
Equity Curve Simulator FAQ
Is an equity curve simulator the same as a backtester
No. A backtester applies strategy rules to historical market data and produces a historical trade list. An equity curve simulator takes strategy statistics or historical trades and randomizes the sequencing to show a range of possible equity paths.
Do I need coding skills to use one
Not necessarily. Plenty of traders can do useful simulation work with spreadsheets or journal tools. Coding helps if you want custom models, but it isn't required to understand sequence risk and drawdown behavior.
What inputs matter most
The core inputs are your win rate, average win, average loss, risk per trade, and trade count. Clean inputs matter more than fancy software.
Should I use fixed risk or compounding
Use the position-sizing model that matches how you'll trade. Fixed risk makes comparisons easier. Compounding is more realistic for some plans. The wrong choice isn't one or the other. The wrong choice is simulating one method and trading another.
Trading involves risk of loss, and simulation results are never a guarantee of future performance. They're a decision tool, not proof.
If you want to put this into practice under clear challenge rules, explore the funding options at MyFundedCapital. Compare the Instant Funding, 1-Step, and 2-Step paths, review the account limits carefully, and start a challenge only after your strategy has passed an honest simulation-based risk check.