Tired of feeling like you're just guessing where to get in and out of trades? This guide will show you how to use a support resistance indicator to identify high-probability trade setups based on market structure, not emotion. You'll learn practical steps to find these levels, set up your charts, and build a disciplined trading strategy around them.
What a Support Resistance Indicator Really Does
A support and resistance indicator automatically plots key price levels on your chart where, historically, buying (support) or selling (resistance) pressure has been strong enough to reverse the market's direction. For an active trader, this is fundamental.
Think of it as creating a high-probability roadmap based on past price behavior. Instead of reacting to every small price move, you can anticipate where the action is likely to happen. This allows you to plan your entries, pre-define your stop-losses, and set realistic profit targets with much greater confidence.
For anyone trading seriously—especially prop firm traders who must follow strict risk rules—mastering these levels is non-negotiable. It's the bedrock of disciplined risk management and consistent performance. Trading involves a substantial risk of loss and is not suitable for all investors.
Understanding the Psychology of Market Levels
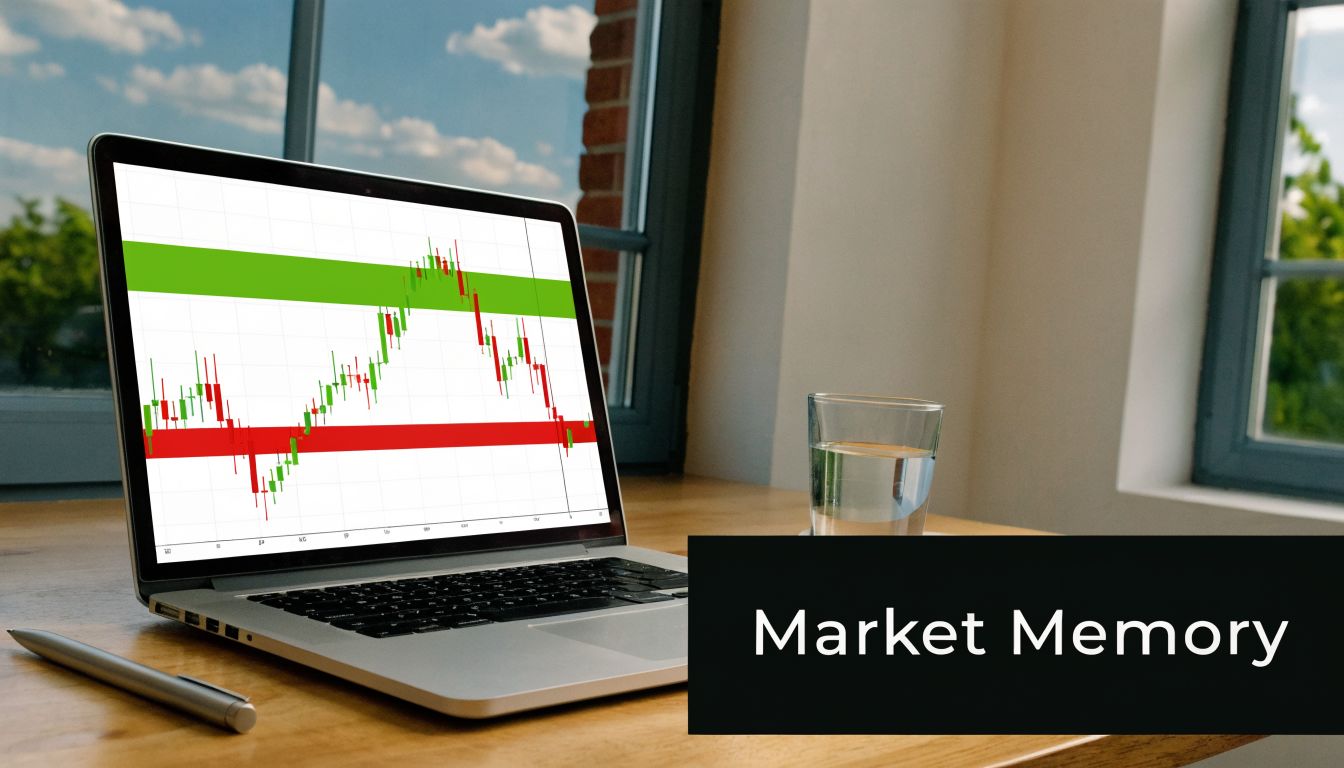
Before you can trust a support and resistance indicator, you have to understand the why behind these levels. They aren't random lines; they're a map of the market's collective memory and emotions.
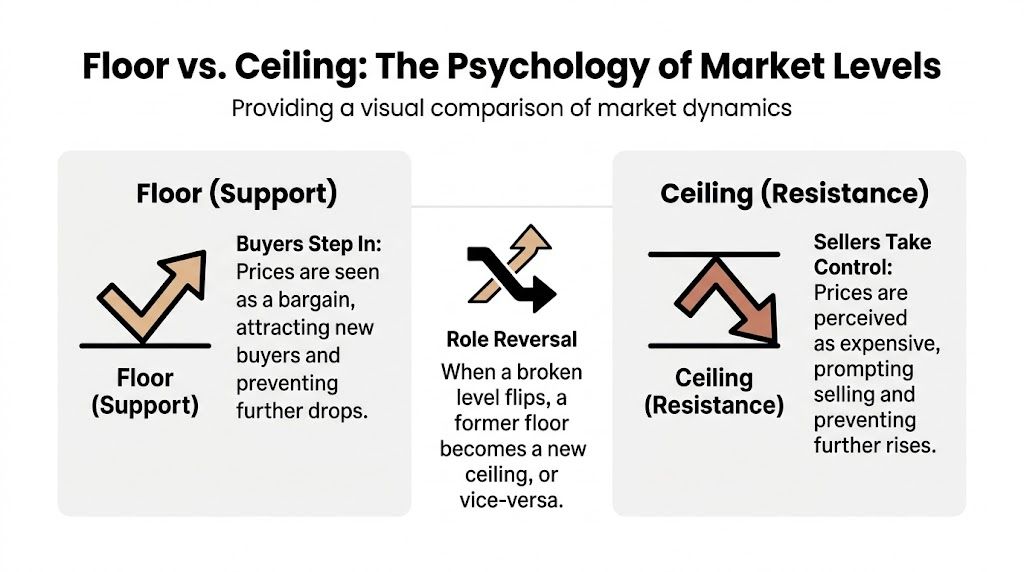
When the price drops and hits a support level, it's where buyers start seeing a good deal. The asset looks undervalued, so they jump in, and that wave of buying interest is often enough to stop the fall and send the price back up. It’s a zone of collective optimism.
The opposite happens at a resistance level. Here, sellers decide it's a great time to cash out profits or open a short position. They feel the asset is getting too expensive, and the resulting selling pressure can halt the rally.
Why Levels Gain Strength
The more times a price level is tested and holds, the more significant it becomes. Traders are creatures of habit. A level that has repeatedly acted as a floor or ceiling gets burned into the market's memory.
Support and resistance indicators are powerful because they visualize this behavior. For instance, many traders watch for the third test of a level. If it holds for a third time, they treat it as a strong confirmation that the zone is a major decision point. You can dive deeper into how indicators help confirm these market patterns on Lux Algo's blog.
The memory of these past turning points creates a self-fulfilling prophecy. Traders anticipate a reaction at these levels, and their collective actions—buying at support and selling at resistance—are what cause the price to react.
The Critical Role Reversal
This is where it gets interesting. When a strong support level finally breaks, it often flips its role and becomes new resistance. Think about it: traders who bought at that support are now at a loss. If the price returns to their entry point, they'll likely sell just to get out at break-even, creating a new wall of selling pressure.
The same thing happens in reverse when resistance breaks—it frequently turns into new support. Understanding this role reversal principle is essential before using any support and resistance indicator. It's the key to reading the market's story.
Types of Support and Resistance Indicators
The "best" support resistance indicator is the one that fits your trading style and timeframe. To choose the right one, you first need to understand the difference between how these levels are constructed.
Static vs. Dynamic Levels
The simplest way to categorize these tools is to ask: does the level move?
Static Levels: These are fixed reference points drawn from historical price action, like a major weekly high or a significant prior low. They stay in the same place until the market decisively breaks through them. They are your go-to for mapping out the big-picture market structure.
Dynamic Levels: These levels move along with the price. The most common examples are moving averages, like the 50-period or 200-period EMA. They recalculate with every new candle, giving you a fluid reference for the current trend, making them ideal for trend-following strategies.
The Trader's Toolkit: Common S/R Indicators
Beyond static versus dynamic, the way an indicator is calculated gives it a unique personality. Here’s a rundown of the most common tools you’ll encounter, with a clear look at their pros and cons.
Comparison of Support and Resistance Indicator Types
| Indicator Type | How It's Calculated | Best For | Pros | Cons |
|---|---|---|---|---|
| Manual Price Action | Manually drawn lines connecting swing highs/lows. | Identifying long-term, significant market structure. | Highly adaptable and based on pure price; forces you to study the chart. | Subjective, time-consuming, and can lead to inconsistency between traders. |
| Pivot Points | Formulas using the previous period's high, low, and close. | Intraday trading; provides a clear roadmap for the session. | Objective and pre-calculated; widely followed by other traders. | Can create noise on the chart; less effective in strongly trending markets. |
| Moving Averages | The average price over a set number of periods (e.g., 50 EMA). | Trend-following and identifying dynamic areas of value. | Adapts to new price action; excellent for gauging momentum. | Lags behind price; can give false signals in choppy, range-bound markets. |
| VWAP | The average price weighted by volume for a single session. | Intraday scalping and mean-reversion strategies. | Shows the "true" average price paid; a magnet for institutional algorithms. | Resets daily, so it's only useful for intraday analysis. |
| Volume Profile | Maps out volume traded at specific price levels over time. | Finding high-liquidity zones that act as strong S/R. | Reveals where the real business was done; highlights institutional footprints. | Can be complex to interpret; requires a good data feed. |
Ultimately, no single indicator is a complete system. The real edge comes from knowing how to blend them together.
Manual Trendlines & Zones: The original method. You simply draw horizontal lines to connect obvious swing highs and lows. The beauty is its simplicity, but its subjectivity is the main drawback.
Pivot Points: A day trader's best friend. They are automatically calculated using the prior day's high, low, and close, giving you a set of objective levels to watch for the current session.
Moving Averages: MAs like the 50 EMA and 200 EMA act as powerful, dynamic levels. In an uptrend, price often dips to the 50 EMA to find buyers. The 200 EMA is the long-term dividing line between bull and bear markets for many traders.
Volume-Based Levels (VWAP & Volume Profile): These tools incorporate volume. The Volume-Weighted Average Price (VWAP) is the average price paid during the day, weighted by volume. Volume Profile shows exactly where the most volume has traded. These high-volume nodes are incredibly reliable zones of support and resistance. Our guide on the best indicators for prop traders breaks these down further.
Pro Tip: Combine two different types of indicators. For example, use static weekly levels to find major battlegrounds and then use a dynamic moving average on a lower timeframe to pinpoint your entry.
For a broader perspective on how data is shaping modern analysis, the datateams guide to predictive models offers a fascinating look into how forecasting is evolving.
How to Set Up and Use a Support Resistance Indicator
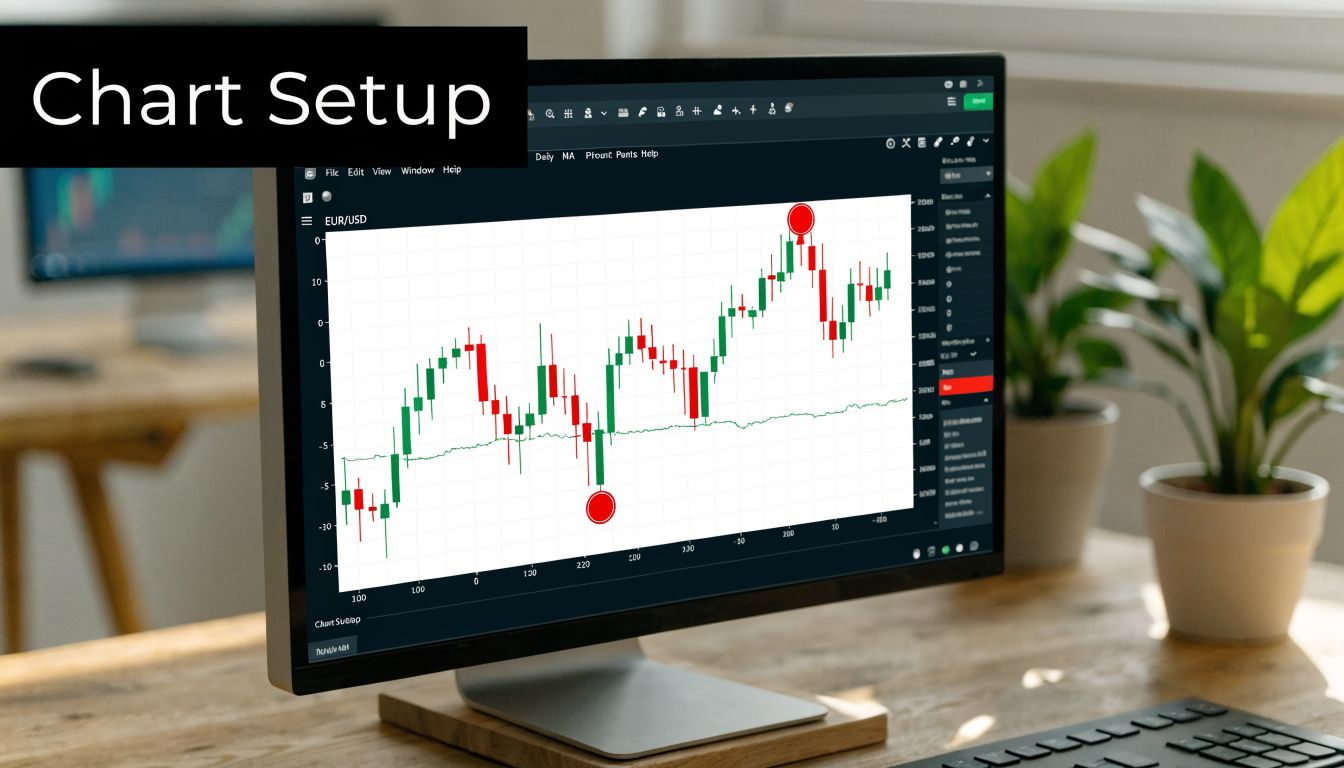
Let's get these tools on your charts. Putting your first support and resistance indicator on a platform like cTrader or DXtrade is simple. We'll start with standard settings that most traders use as a foundation.
Don't worry about finding the "perfect" setting right away. The goal is to establish a consistent baseline. Once that's in place, you can tweak parameters to match your specific trading style.
Initial Setup for Common Indicators
Most trading platforms make this easy. You can typically find an "Indicators" menu on your chart. Here are the go-to, industry-standard settings to start with:
Moving Averages (EMA/SMA):
- Short-Term Trend: Use a 20 or 21-period Exponential Moving Average (EMA) for immediate momentum.
- Medium-Term Trend: The 50-period EMA is a classic for gauging the intermediate trend.
- Long-Term Trend: The 200-period Simple Moving Average (SMA) is often seen as the definitive line between a bull and a bear market.
Pivot Points:
- Calculation: Stick to the "Standard" or "Classic" formula. This is the most common method, meaning more traders are watching the same levels.
- Timeframe: For day trading, set this to "Daily" to project levels for the current session.
Volume-Weighted Average Price (VWAP):
- Session: Use the "Session" or "Daily" reset. This ensures the VWAP calculation begins fresh each day.
Remember: These are starting points. A scalper on a 1-minute chart might use faster MAs, while a swing trader on a daily chart will use slower ones. Start with what's standard and adjust only for a specific, strategic reason.
Automating Alerts with cTrader
One powerful feature in platforms like cTrader is automated alerts. This saves you from being chained to your screen. With the cTrader Automate API, a few lines of C# code can create a bot that watches the market for you.
Here’s a quick cBot example that will print a message to your trade log when the price breaks a resistance level set at 1.07500:
using cAlgo.API;

namespace cAlgo.Robots
{
    [Robot(TimeZone = TimeZones.UTC, AccessRights = AccessRights.None)]
    public class PriceAlertBot : Robot
    {
        private double resistanceLevel = 1.07500;
        private bool alertTriggered = false;

        protected override void OnTick()
        {
            // Check if price crosses above the resistance level
            if (Symbol.Bid > resistanceLevel && !alertTriggered)
            {
                Print("Price has crossed above the resistance level: " + resistanceLevel);
                alertTriggered = true; // Prevents repeated alerts
            }
        }
    }
}
A simple script like this turns a static line into an active assistant. For traders on the move, check out our guide on adding MT4 mobile custom indicators for more platform-specific tricks.
Two Core Strategies for Trading These Levels
Finding the right support and resistance levels is step one. The art lies in what you do when price gets there. Here are two primary game plans. Remember, no strategy is a sure thing, which is why risk management must be locked in before you trade.
Strategy 1: Playing the Bounce (Mean Reversion)
This strategy involves betting that a level will hold. You anticipate a support "floor" or a resistance "ceiling" will repel the price, causing it to reverse. This approach works well in consolidating or range-bound markets.
Here’s a step-by-step checklist:
- Pinpoint a Proven Level: Use your indicator to find a support or resistance zone with a solid track record.
- Wait for Price to Arrive: Be patient. Don't chase the price toward your level.
- Look for Confirmation: This is crucial. Never enter just because price touches your line. Look for candlestick patterns like a pin bar, hammer, or an engulfing candle that signals rejection.
- Define Your Exit (Stop-Loss): Place your stop-loss just on the other side of the zone. For a long trade at support, set your stop a few pips below the zone.
- Set a Sensible Target (Take-Profit): Your first target should be the next major obstacle. If you bought a bounce off support, your target is often the nearest resistance.
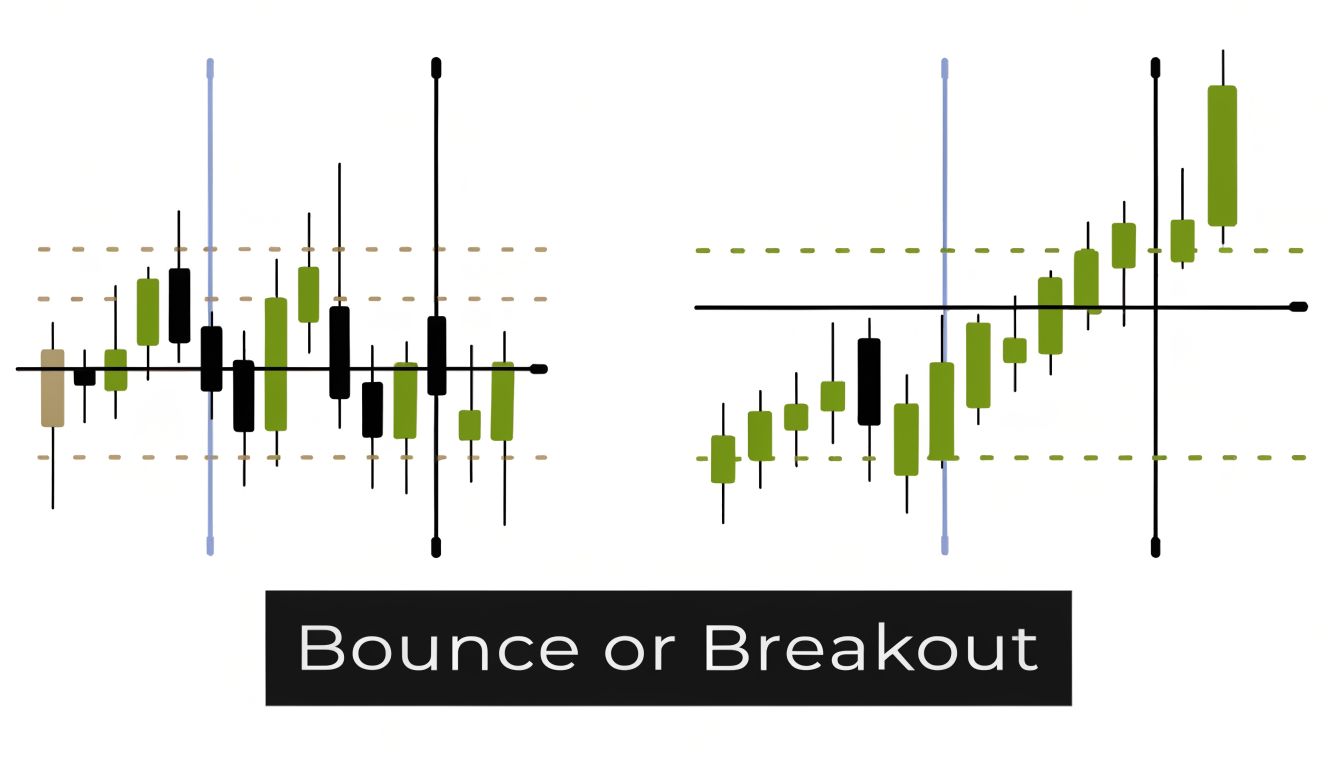
Strategy 2: Trading the Breakout (Momentum)
Here, you anticipate a level will shatter, unleashing a powerful move. This momentum strategy thrives in trending markets.
Crucial Insight: A real breakout almost always comes with a surge in volume. This is your confirmation. A breakout on low volume is often a "false breakout" or trap.
Here’s the playbook for a breakout:
- Entry: Wait for a candle to close decisively beyond the level. Jumping in the second it pierces the line is a rookie mistake.
- Stop-Loss Placement: A smart place for your stop is on the other side of the level that just broke. If price breaks above resistance, that old ceiling should become your new support. Place your stop just below it.
- Take-Profit Targets: A common technique is to measure the height of the previous trading range and project that distance from the breakout point.
Confirmation is vital. As you'll see in resources from atas.net, these levels are tied to volume and order flow. Strong volume gives you confidence a level will break, while weak volume suggests it will fail.
Aligning Your Strategy with Prop Firm Risk Rules
A great strategy is useless if it gets you kicked off your funded account. Your support and resistance levels are your best friend for risk management, keeping you within the prop firm's rules.
Most prop firms have a daily loss limit (e.g., 5%) and a maximum drawdown (e.g., 10%). Your S/R levels give you a logical, data-driven spot to place your stop-loss. No more guessing.
Calculating Position Size to Stay in the Game
Build your trading plan around these risk limits. S/R zones provide a framework for calculating your position size before you enter a trade. This ensures no single trade can blow up your account.
Here's a practical example with a $100,000 account and a 5% daily loss limit ($5,000):
- Spot Your Entry: You see a long setup at a support level of $1.07200.
- Define Your Exit: You place your stop-loss just below the support zone at $1.07100. This is a 10-pip stop.
- Set Your Trade Risk: You decide to risk 1% of your account ($1,000) on this trade, well under your daily limit.
- Calculate Your Position: Divide your max risk by the distance to your stop. With a 10-pip stop and assuming $10/pip per lot, your position size would be 10 lots ($1,000 risk / (10 pips * $10/pip)).
This pre-trade calculation is non-negotiable. Basing position size on a logical stop-loss derived from an S/R level builds a professional, risk-first process.
This instills the discipline that separates amateurs from pros. It also helps you adhere to what prop firms call the consistency rule in prop firm trading. They want to see a predictable, repeatable process, not just lucky wins.
FAQ: Common Questions About Support and Resistance
What are the best support and resistance indicators for beginners?
For beginners, it's best to start simple. Manual trendlines and horizontal support/resistance zones are excellent because they force you to study price action. Once comfortable, adding Pivot Points (for their objectivity) or Moving Averages (like the 50 and 200 EMA) provides a great next step without cluttering your chart.
How do I know if a support or resistance level is strong?
A level's strength is typically determined by three factors:
- Timeframe: Levels on higher timeframes (Weekly, Daily) are more significant than those on a 5-minute chart.
- Touches: The more times a level has been tested and held in the past, the stronger it is considered.
- Confluence: A level becomes much stronger if multiple indicators align there (e.g., a horizontal support line also happens to be where the 200-day moving average is).
Should I use support and resistance lines or zones?
Think in zones, not exact lines. The market is driven by human emotion, not a perfect mathematical formula. Price will often overshoot or undershoot an exact line. Drawing a small "zone" or box around a key level gives your trade more breathing room and better reflects how markets actually behave.
Which timeframe is best for identifying support and resistance?
There is no single "best" timeframe. Professionals use a top-down approach:
- Higher Timeframes (Daily, Weekly): Use these to identify the major, significant levels that control the bigger picture.
- Lower Timeframes (1-Hour, 15-Minute): Zoom into these to find precise entry signals and manage the trade once price reaches a major higher-timeframe zone.
Start Applying These Strategies Today
You now have a practical framework for using a support resistance indicator. Remember, no indicator is a crystal ball. These levels are part of a trading blueprint, not a guarantee of profit. Success is forged when you combine technical analysis with unbreakable risk management and the discipline to follow your plan.
Trading involves a significant risk of loss and this content is for educational purposes only and is not financial advice. If you've honed your strategy and are confident in your execution, the next step could be proving your skills in a simulated professional environment.
Ready to prove your skills? Explore the funding programs at MyFundedCapital and start your challenge today.