
Feeling the sting of buying right at the peak only to watch the market reverse? The rising wedge pattern is a classic bearish signal that can help you avoid this common pitfall. This guide will show you how to identify this pattern, understand the psychology behind it, and build a practical trading plan to act on it.
The rising wedge pattern is formed by two upward-sloping trendlines that squeeze the price action tighter and tighter. Visually, it looks like an uptrend that’s running out of steam. For traders, this is a crucial warning sign that buying momentum is fading and a significant drop could be just around the corner.
What Is the Rising Wedge Pattern?
One of the biggest challenges in trading is knowing when a strong trend is about to die. It's easy to get swept up in the bullish excitement, but the rising wedge gives us a clear, visual clue that the party might be over. Learning to spot this pattern helps you get ahead of the crowd and anticipate a reversal before it happens.
The story behind the rising wedge is all about market exhaustion. While the price is technically still making higher highs and higher lows, each push upward is weaker than the last. Think of it like a ball being thrown up a steep hill—at first, it travels a good distance, but with each bounce, it gains less and less height until it finally rolls back down.
That "tightening" of the price action, where the support line rises faster than the resistance line, shows that buyers are losing their conviction. Once that lower support trendline is broken, it's often a mad dash for the exits as trapped buyers scramble to close their positions, fueling a rapid sell-off.
Rising Wedge Pattern Quick Facts
| Characteristic | Description |
|---|---|
| Pattern Type | Bearish Reversal |
| Prior Trend | Uptrend |
| Trendlines | Two converging, upward-sloping lines |
| Volume | Typically diminishes as the pattern forms |
| Confirmation | A decisive break below the lower support line |
| Psychology | Fading bullish momentum and buyer exhaustion |
This table serves as a quick cheat sheet, but mastering the pattern comes from understanding the why behind these characteristics.
Why This Pattern Matters for Your Trading
For anyone trading with a prop firm, especially under a funded challenge, mastering patterns like the rising wedge is a game-changer. Your success depends on finding trades with a statistical edge and keeping risk under tight control. The rising wedge offers exactly that: a clear, repeatable setup with a strong historical track record.
The rising wedge pattern is widely regarded as one of the most dependable bearish reversal signals in technical analysis. Comprehensive backtests show it has an impressive 81% success rate in bull markets. For a deeper dive into the historical performance of various chart patterns, you can explore this detailed analysis of chart patterns in forex.
Adding this pattern to your toolkit can dramatically improve your trading by helping you:
- Anticipate Trend Reversals: Get a crucial early warning that an uptrend is losing steam.
- Identify High-Probability Entries: Pinpoint the exact breakdown level for entering a short position with confidence.
- Improve Risk Management: Use the pattern's clear structure to set a tight, logical stop-loss right above the breakdown point.
Ultimately, the rising wedge is a fundamental piece of the technical analysis puzzle. By learning to spot it, you stop falling into the trap of buying into a market that looks strong on the surface but is secretly weakening. Instead, you can position yourself to profit from the reversal that most others don't see coming.
Disclaimer: Trading involves a substantial risk of loss and is not suitable for all investors. This content is for educational purposes only and is not financial advice.
How to Correctly Identify a Rising Wedge
Mistaking a random consolidation for a real chart pattern is an expensive habit. To a new trader, any upward-sloping price action can look like a rising wedge, but learning to spot a valid one requires a strict, rules-based eye. If you get it wrong, you’ll find yourself on the wrong side of a move, fighting a trend that hasn't actually reversed.
Think of it like this: a genuine rising wedge isn't just a shape; it's a story unfolding on your chart. It tells you that even as the price inches higher, the buying pressure is quietly fading away. We're looking for specific clues that confirm this story. If even one is missing, the pattern is questionable, and the best trade is often no trade at all.
This flowchart breaks down the decision-making process into simple, visual steps.
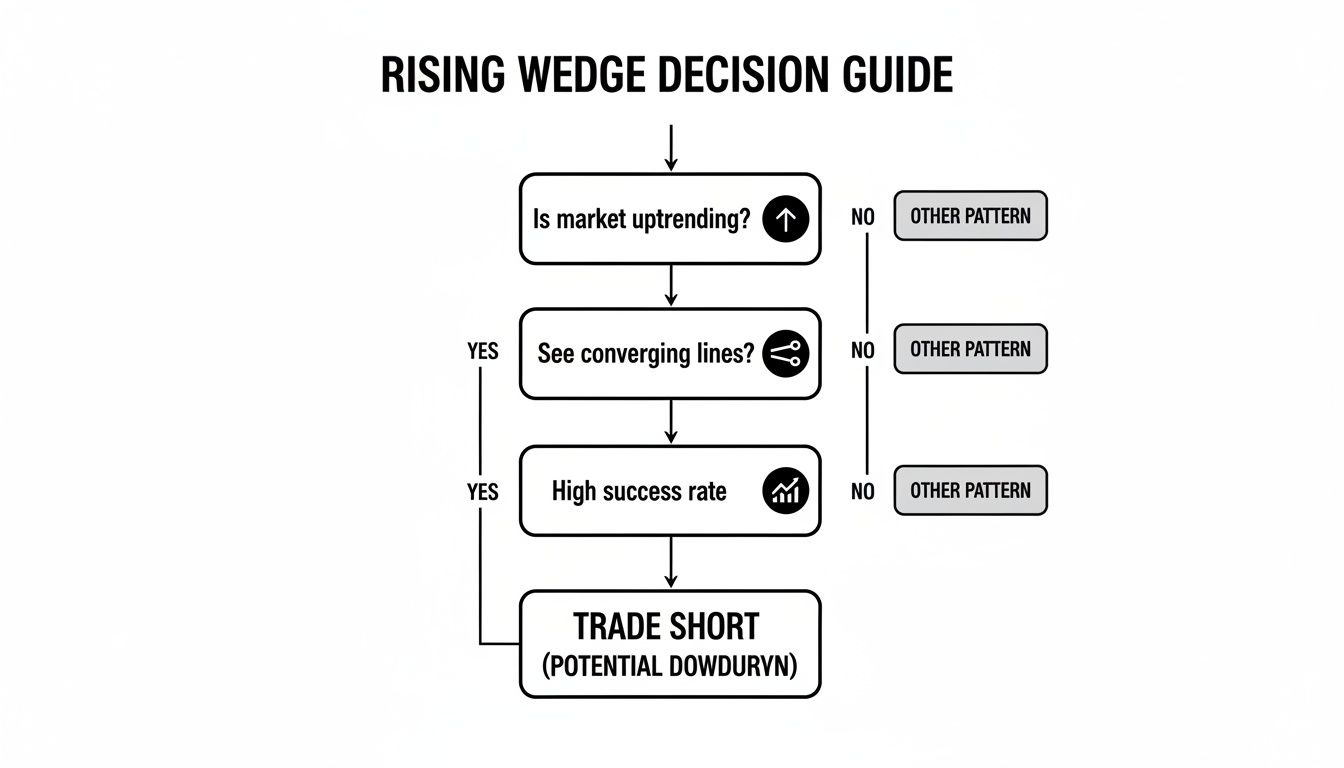
The pattern’s reliability doesn’t come from one single factor but from a sequence of conditions all lining up perfectly.
The Anatomy of a Valid Wedge
First things first, you need to draw the two trendlines that define the pattern. These aren’t just arbitrary lines; they have to connect specific highs and lows.
- Upper Resistance Line: Draw this by connecting at least two, but ideally three, consecutive higher highs. Each new peak must be higher than the last.
- Lower Support Line: This line connects at least two, but again, ideally three, consecutive higher lows. Each trough must also be higher than the one before it.
But here’s the most important part—the relationship between these two lines tells you everything.
For a rising wedge to be valid, the lower support trendline must be steeper than the upper resistance trendline. This geometry forces the lines to converge, literally squeezing the price into an ever-tightening range. This visual compression is the ultimate tell-tale sign of buyer exhaustion.
If the lines look parallel, what you’re seeing is a bullish channel, which has completely different implications. It’s the convergence that signals sellers are stepping in earlier and more aggressively on each rally. You can dive deeper into these distinctions in our guide to the broader wedge trading pattern.
The Volume Confirmation Rule
The second, non-negotiable piece of the puzzle is volume. A textbook rising wedge is almost always confirmed by a very specific volume signature that backs up the story of fading momentum. As the price grinds higher inside the wedge, trading volume should be visibly drying up.
This drop-off in volume is a huge red flag. It shows that fewer and fewer participants are willing to chase the price higher. The conviction is gone.
The final confirmation happens at the breakdown. When price finally snaps the lower support trendline, you must see a significant spike in volume. That surge is your evidence that sellers have wrestled back control and are now driving the reversal with force.
A Checklist for Identifying a Rising Wedge Pattern
Before you even think about placing a trade, run every potential setup through this checklist:
- Prior Trend: Does the pattern form after a clear and sustained uptrend?
- Trendline Touches: Do you have at least two (ideally three) higher highs for resistance and two (ideally three) higher lows for support?
- Convergence: Is the lower support line clearly steeper than the upper one, causing the lines to narrow?
- Volume Decline: Is trading volume noticeably decreasing as the wedge progresses?
- Breakout Volume Spike: Did the candle that broke support close on a clear spike in volume?
Recent analysis backs up these rules. The most reliable formations tend to develop over 10-50 price periods (e.g., candles) and are strongest when both trendlines have at least three touches. If a setup you're watching fails any of these tests, the probability of it being a fakeout goes up dramatically. It’s better to be patient and wait for all the pieces to fall into place.
Crafting Your High-Probability Trading Plan

Alright, so you’ve learned how to spot a rising wedge. That's a great start, but it's only half the job. Seeing the pattern is one thing; trading it for consistent profit is something else entirely. To do that, you need a rock-solid plan.
A complete trading strategy takes the emotion and guesswork out of the equation. It means you know exactly where you’re getting in, where you’re getting out if you’re wrong, and where you’re taking profits—all before you risk a single cent. This is how you stay disciplined, especially when you're managing risk for a prop firm like MyFundedCapital, where every decision counts.
Choosing Your Entry Trigger
The moment the price slices through that lower support line, you have a choice to make. Do you jump in right away or wait for more confirmation? There are two classic ways to enter, and the one you choose says a lot about your trading style.
Method 1: The Aggressive Entry
This is for the decisive trader. The plan is simple: enter a short position as soon as a candle closes firmly below the wedge's support line.
- Trigger: You're looking for a full candle body to close below the trendline. A wick poking through doesn't cut it—you want to see real conviction from sellers.
- The Good: You get in early. In a market that's dropping like a rock, there might not be a second chance. This entry ensures you catch the move right from the start.
- The Bad: You have a higher chance of getting trapped in a fakeout. Price can easily dip below support, tricking sellers into the market, only to snap right back into the wedge.
Method 2: The Conservative Entry
This is the patient trader's approach. Instead of jumping in on the break, you wait for the price to come back and retest the line it just broke. That old support has now flipped into new resistance.
- Trigger: Price breaks down, then rallies back up to the old support trendline. You enter your short when you see it get rejected there—think a bearish pin bar or a strong push down.
- The Good: The risk-to-reward on this entry is fantastic. Your entry price is higher, which means you can use a much tighter stop-loss. It’s also powerful confirmation that the bears are truly in control.
- The Bad: Sometimes, the market just doesn't give you a retest. When selling pressure is intense, the price might just keep falling, and you'll be left on the sidelines waiting for a pullback that never comes.
Setting a Logical Stop-Loss
Your stop-loss isn't just a number; it's your line in the sand. It’s the point where you admit your trade idea was wrong and get out with a small, manageable loss before it becomes a big one. For a rising wedge, the placement is incredibly intuitive.
The most reliable spot for your stop-loss is just above the last swing high created inside the wedge before the breakdown.
Think about it—if the price manages to rally all the way back up and break through that peak, the bearish structure is gone. The pattern has failed. Placing your stop there keeps you safe from random market noise while giving the trade a clear point of invalidation.
Defining Your Profit Targets
Knowing when to cash out is just as critical as knowing when to get in. Without a clear target, you’re just guessing. You might cut a winner short or, even worse, watch your profits evaporate. With the rising wedge, we have two solid methods for setting targets.
Method 1: The Measured Move
This is a classic technique straight from the technical analysis playbook. It gives you a logical, data-based price objective.
- Measure the Height: Go back to the widest part of the wedge and measure the vertical distance from the first swing high to the first swing low.
- Project Downward: Take that exact distance and project it down from the point where the price broke through the support line.
That projected level is your minimum target for the trade. It’s what the pattern itself suggests is possible.
Method 2: Key Support Levels
This approach uses the chart's history to find your exit. Price has memory, and past battlegrounds between buyers and sellers are often revisited.
- Look to the left of the wedge on your chart. Find the major support levels where the price bounced before the wedge even started to form.
- These old floors are natural magnets for a falling price. They make for excellent, high-probability areas to take your profit, as that's where buyers might decide to step back in.
Many experienced traders will actually combine both. They might take some profit off the table at the measured move target (Target 1) and leave the rest of the position to run to a major historical support level (Target 2). This kind of disciplined, multi-stage exit strategy is what separates the pros from the crowd.
Real Chart Examples of the Rising Wedge
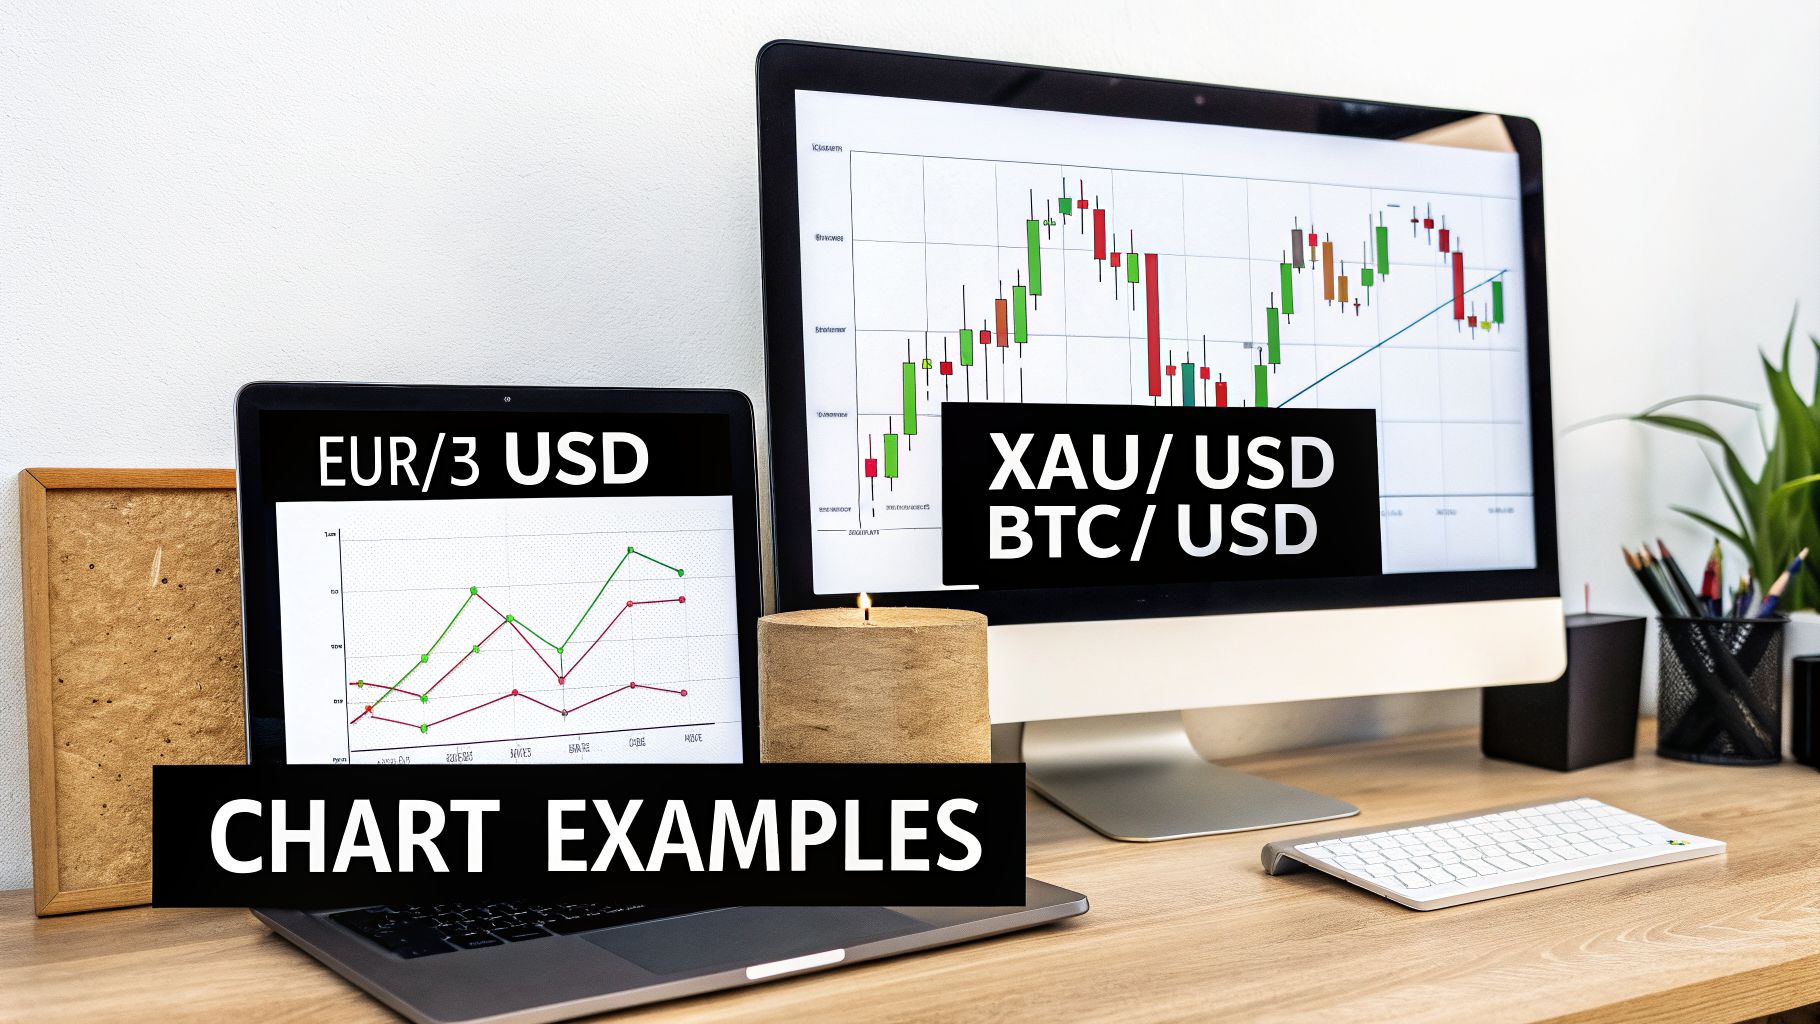
Theory is one thing, but watching a pattern unfold on a live chart is how you really learn to trust it. Let's move from the textbook to the trading floor and look at some real-world examples of the rising wedge pattern.
We'll dissect a few trades across different markets and timeframes. I want you to see how the converging trendlines, the classic volume drop-off, and the final bearish break all come together. Pay close attention to how the entries, stops, and targets are managed—this is how you build a repeatable process for spotting and trading these setups with confidence.
Swing Trade Example on Gold (XAU/USD) 4-Hour Chart
Swing traders love higher timeframes like the 4-hour chart because they can catch moves that last for days. Here’s a perfect example of a rising wedge that formed on Gold after a powerful run-up.
- Identification: The initial uptrend was strong, but then the price action started to get squeezed. You can see two clear, upward-sloping trendlines that are converging. Notice how the lower support line is steeper—that’s a huge clue that the buyers are running out of steam.
- Volume Confirmation: As the wedge got tighter, look at the volume bars at the bottom of the chart. They're clearly shrinking. This is the market whispering that the bullish momentum is fading.
- Breakout & Entry: The signal to act came when a big, bearish 4-hour candle closed right below the lower support line. Crucially, this break happened with a sudden spike in volume. A good entry would be to go short right after that candle closes.
- Risk Management: Where does the trade go wrong? We place our stop-loss just above the last swing high that was made inside the wedge. If the price goes back up there, our bearish idea is invalidated, and we get out.
- Profit Target: To set a target, we measure the height of the wedge at its widest part. Then, we project that same distance down from where the price broke out. In this trade, that target was hit a few days later as sellers took complete control.
Day Trade Example on EUR/USD 15-Minute Chart
The beauty of chart patterns is that they're fractal—they show up on every timeframe. Here’s how a day trader could have used the exact same pattern on a 15-minute EUR/USD chart for a trade that was over in just a few hours.
- The Setup: During the London session, EUR/USD was pushing up but the rally felt weak. The price got jammed between two converging trendlines, carving out a clean rising wedge.
- The Volume Story: Just like our Gold example, volume was highest at the start of the move and then fizzled out as the wedge formed. This is a classic signal that the move is exhausted.
- The Trigger: A bearish candle broke and closed below support. While you could have entered there, the market offered an even better entry. The price pulled back to retest the trendline it just broke, which now acted as new resistance. Shorting the rejection of that retest gives you a much tighter stop and a fantastic risk-to-reward ratio.
- The Execution: The stop-loss went just a few pips above that retest high. The profit target was set at a key support level from earlier in the session, and it was hit quickly as selling pressure ramped up into the New York open.
This intraday trade proves you don't need to wait days for a setup to play out. The core principles are identical, just on a much faster timeline.
It’s crucial to distinguish a rising wedge from its bullish counterpart. A rising wedge is bearish, while a falling wedge is bullish. Understanding the key differences is essential for accurate analysis.
To help you tell them apart at a glance, it's useful to see them side-by-side. One signals buyer exhaustion, the other signals seller exhaustion.
Rising Wedge vs Falling Wedge Comparison
| Feature | Rising Wedge | Falling Wedge |
|---|---|---|
| Pattern Type | Bearish Reversal or Continuation | Bullish Reversal or Continuation |
| Trendlines | Upward-sloping, converging | Downward-sloping, converging |
| Price Action | Higher highs and higher lows | Lower highs and lower lows |
| Breakout Direction | Downside (bearish) | Upside (bullish) |
| Market Psychology | Fading buying momentum | Fading selling momentum |
Memorizing this table will prevent you from making the costly mistake of misidentifying the pattern and trading against the probable breakout direction.
Crypto Example on Bitcoin (BTC/USD) Daily Chart
The crypto markets, famous for their epic trends and volatility, are another great place to hunt for these patterns. Let’s break down a huge rising wedge that formed on the Bitcoin daily chart.
After a massive, almost parabolic rally, Bitcoin's ascent started to slow down. Over several weeks, it formed a large rising wedge. You could just feel the momentum draining away as each new high barely surpassed the previous one. As the price neared the wedge's apex, the daily volume was a shadow of what it was at the beginning of the pattern.
The breakdown, when it finally came, was dramatic. A massive red daily candle crashed through the lower support trendline, and it happened on a huge surge in volume. This was the market screaming that the bears were now in charge.
Traders who spotted this pattern early were ready for the breakdown. They were perfectly positioned for the massive, multi-week decline that followed. The initial price target, based on the wedge height, was met, but the sell-off continued much further, eventually finding a floor at deeper historical support levels.
Managing Risk in a Prop Firm Environment
Spotting a perfect rising wedge is one thing. Trading it without blowing up your funded account is another game entirely. For any serious trader looking to get and stay funded, your trading strategy has to live and breathe within the firm's rules. One sloppy, oversized trade can get you flagged and lose you the account.
The good news is that the rising wedge is a trader’s best friend in a rule-based environment. Why? Because it’s not a vague, subjective pattern. It gives you a clear line in the sand for your stop-loss (the last swing high) and obvious points to aim for as targets. This lets you calculate your exact risk before you even think about hitting the buy or sell button. That's not just a good habit; it's how you survive and thrive.
Aligning Trades With Prop Firm Rules
Let's make this real. Say you're at the helm of a $100,000 account with MyFundedCapital. You have to respect the hard deck:
- 5% Daily Loss Limit: You absolutely cannot lose more than $5,000 in a single trading day.
- 10% Maximum Drawdown: Your account equity can never, ever dip below $90,000.
These aren't suggestions—they're the boundaries of your career. Your mission is to place high-probability trades, like a rising wedge breakdown, while making dead certain that even a losing trade won't put you anywhere near those limits. The professional standard is simple: risk no more than 1% of your capital on any single idea.
On a $100,000 account, that 1% risk is a clean $1,000. Adopting this rule puts you in a powerful position. If a trade goes sour, you’ve only used a fifth of your daily loss allowance. You’re still in the game, calm and collected, ready to find the next quality setup without pressure.
A Practical Position Sizing Example
Let's walk through sizing up a rising wedge on EUR/USD, locking our risk at that crucial 1% mark.
- Identify Your Entry and Stop-Loss: You've found a clean rising wedge on the EUR/USD 1-hour chart. The plan is to go short at 1.0850 as the price breaks support. Your stop-loss goes right above the most recent swing high within the pattern, at 1.0900.
- Calculate Your Risk in Pips: Simple math. The distance from your entry (1.0850) to your stop (1.0900) is 50 pips. This is how much room you're giving the trade before you admit it's not working.
- Determine Your Risk in Dollars: On your $100,000 account, your 1% risk cap is $1,000. This is the maximum you are willing to lose on this specific trade.
- Calculate Pip Value: Now we connect the pips to the dollars. The formula is Risk in Dollars / Risk in Pips = Pip Value. So, $1,000 / 50 pips = $20 per pip.
- Determine Your Position Size: With a standard lot (1.0) of EUR/USD having a pip value of roughly $10, you'll need to trade 2.0 standard lots to get the $20 per pip value you calculated.
By following this exact process, you've perfectly engineered the trade to fit your risk model. If the price turns against you and hits your stop at 1.0900, you lose exactly $1,000—nowhere near your $5,000 daily limit. Mastering these steps is the bedrock of building effective forex risk management strategies.
This deliberate approach is what separates professional trading from gambling. You aren't just hoping for the best. You're defining your maximum loss upfront and ensuring it fits squarely within the firm's rules, protecting your capital and your career as a funded trader.
This kind of discipline is completely non-negotiable. It’s what allows you to take advantage of a high-probability pattern like the rising wedge without ever exposing yourself to a knockout blow. Every trade becomes a calculated, professional risk on a setup that has a known edge—and that’s the exact mindset needed to pass challenges and earn consistent payouts.
Frequently Asked Questions (FAQ)
What's the difference between a rising wedge and an ascending channel?
A rising wedge has two converging trendlines, where the lower support line is steeper than the upper resistance line. This "squeezing" action signals buyer exhaustion and a potential bearish reversal. An ascending channel has two parallel, upward-sloping trendlines, indicating a healthy, steady uptrend with no signs of exhaustion.
How long should a rising wedge take to form?
There's no fixed time duration. Instead, look at the number of candles or price bars. A reliable rising wedge typically forms over 10 to 50 price periods. On a 15-minute chart, this could be a few hours; on a daily chart, it could take several weeks. The longer the pattern takes to form, the more significant the potential breakout move can be.
What if volume doesn't decrease as the wedge forms?
Be very cautious. Declining volume is a critical confirmation that buying momentum is fading. If volume remains high or increases as the wedge forms, it suggests buyers are still in control, and the pattern is less reliable. It could be a trap that leads to a failed breakdown or a surprise breakout to the upside.
Can a rising wedge appear in a downtrend?
Yes, and when it does, it acts as a bearish continuation pattern. In this context, the wedge represents a weak corrective bounce within a larger downtrend. When the price breaks down from the wedge's support, it signals that the pause is over and the primary downtrend is likely to resume.
Ready to trade with a real edge? Check out the funding programs at MyFundedCapital and start your journey to becoming a funded trader.